New-GPU-Profiler-and-RHI-Submission-Pipe
https://m.youtube.com/watch?v=vnbARZHccpQ

Thank you for joining. My name is Luke Thatcher. I'm a principal rendering programmer on the RHI team at Epic.

And this is our session on the new GP profiler and RHI submission pipeline.
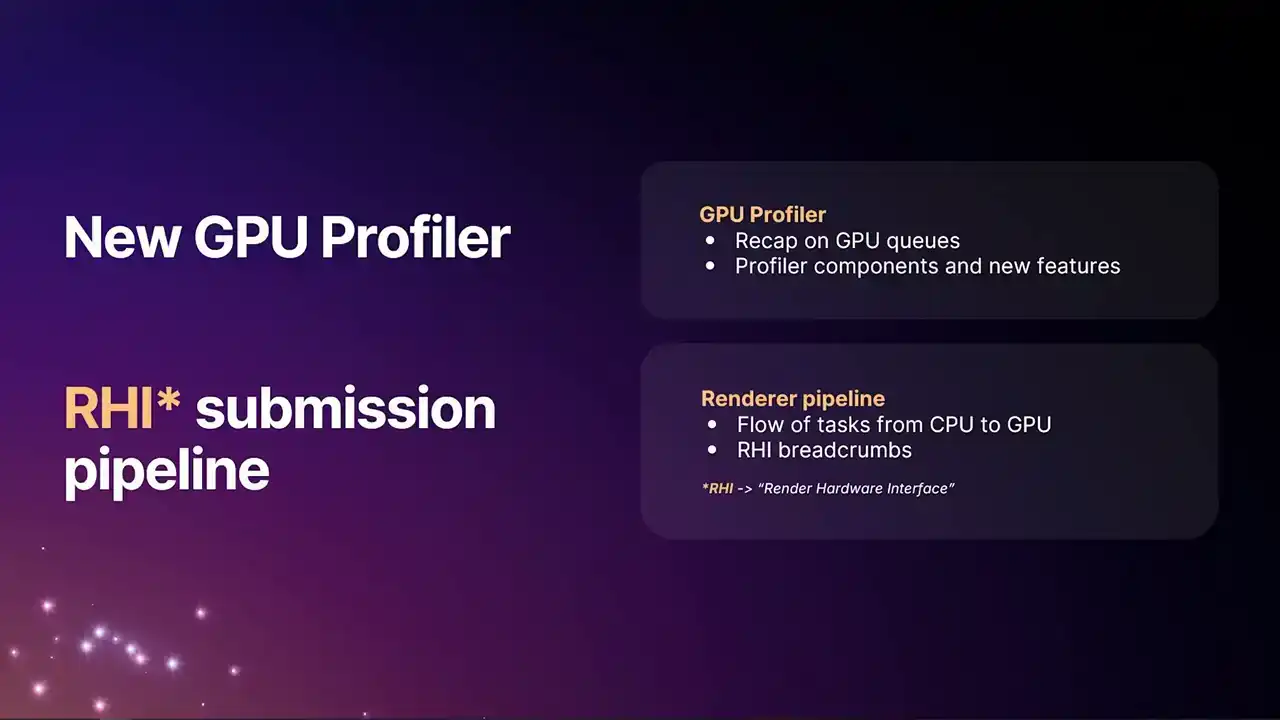
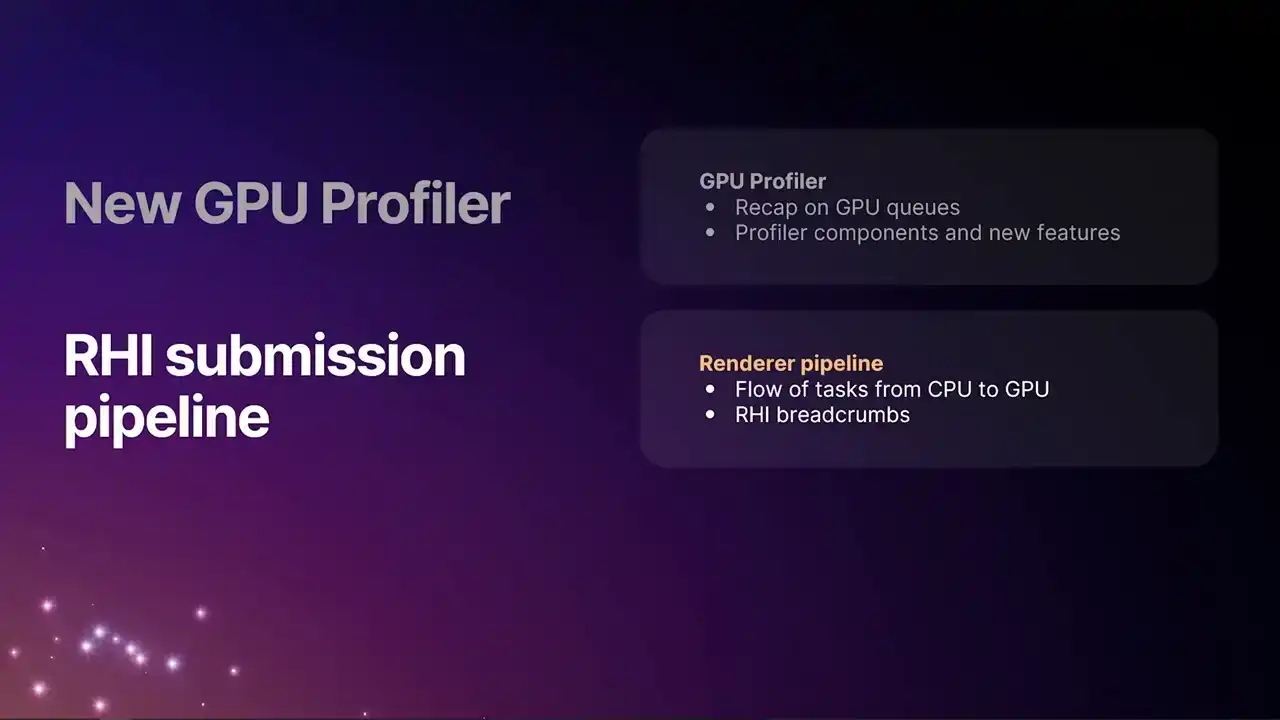
So this session will be one that's in kind of two halves, really. First section, I'm going to talk about what we've done to the new GP profiler in Unreal 5.6 and the improvements that we've made there. And in the second half, I'll be going over a deep technical dive into the RHI submission pipeline. This was something that we shipped in 5.5, but we haven't publicly spoken about yet. And just for anyone who's curious, RHI stands for Render Hardware Interface. It's one of those acronyms that we throw around quite a lot, but we don't tend to define very much. So yeah, the RHI is the module of the engine that sits between the renderer and the GPU platform API.
And we implement one of these per platform, and it's what provides the platform support for graphics.

But before we dive into that, let's have a quick recap on GPU queues, as this will set some of the scene
for some of the changes that we've made in the profiler. Some of this you may already be familiar with, but it's probably worth just having a quick refresh.
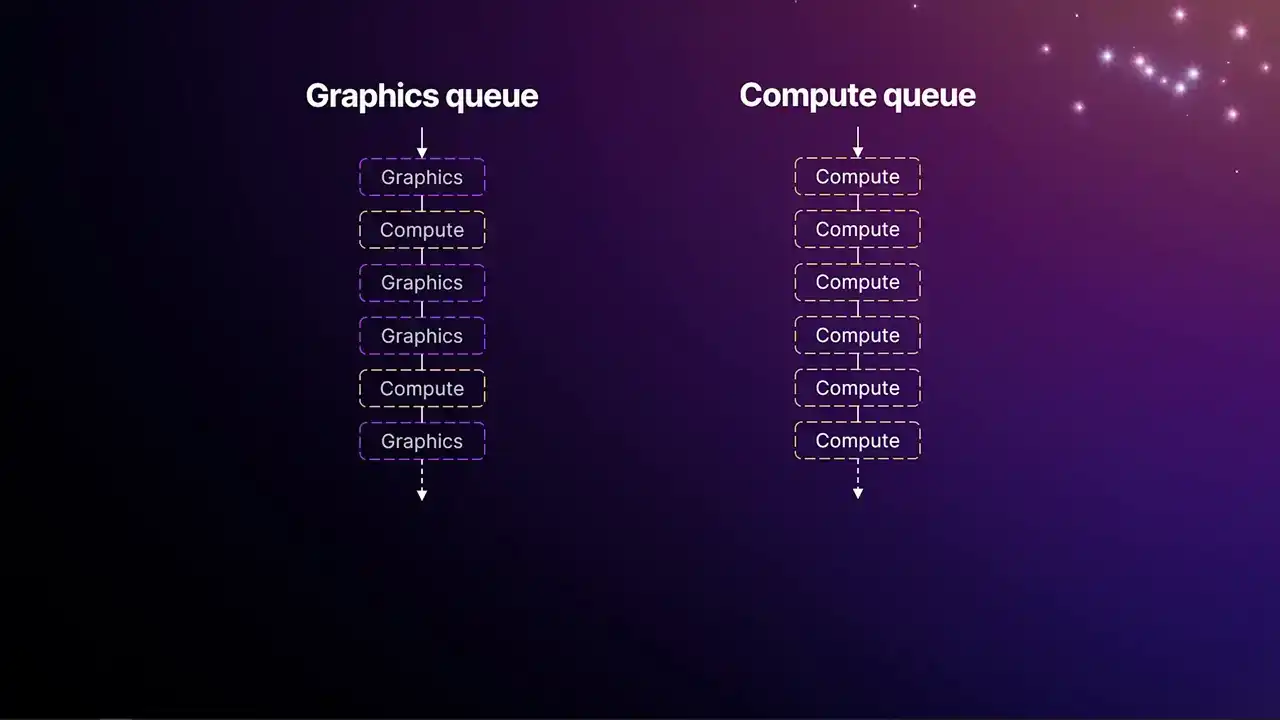
So for the best part of a decade now, GPUs have had multiple queues. These queues you can think of as almost like hyperthreading on a CPU, multiple threads on a CPU, in that we have two or more independent queues of work that the application can submit to. And they run concurrently, and they sort of intelligently share the execution resources on the GPU. Typically, there's always a single graphics queue. And the graphics queue can access the full traditional rasterization pipeline, so depth of stencil testing, vertex pixel shaders, all that stuff.
But it can also run compute jobs. And then you typically have either one or more compute queues that can only run compute shaders. And of course, the jobs submitted to these queues
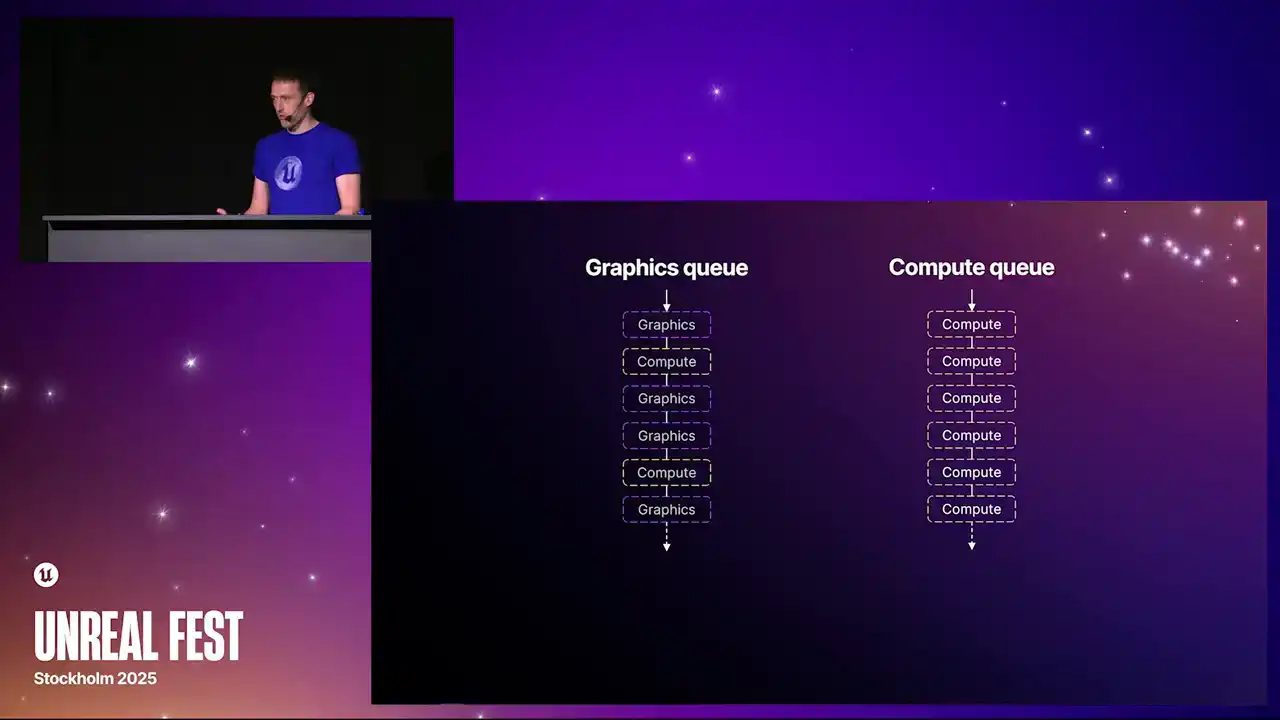
can run concurrently with each other, but that's not always desirable. We tend to have jobs that create data on one pipe and need to be consumed by another pipe. So we need some way of synchronizing these two pipes together. And that's where we get fences. So fences are synchronization primitives that are used to prevent one queue from advancing any further until the signal has come from the other queue that was producing that data. So in this case, those three compute jobs on the right-hand side on the compute queue can't start work until the graphics queue has completed that first piece of work in the upper left. And then we get that signal of fence A, and then the wait for fence A to allow everything to advance. And then coming back the other way, those last three jobs on the graphics queue can't start until that signal has passed on the compute queue. And one thing that's interesting to note about this is that because these waits stall the queues,
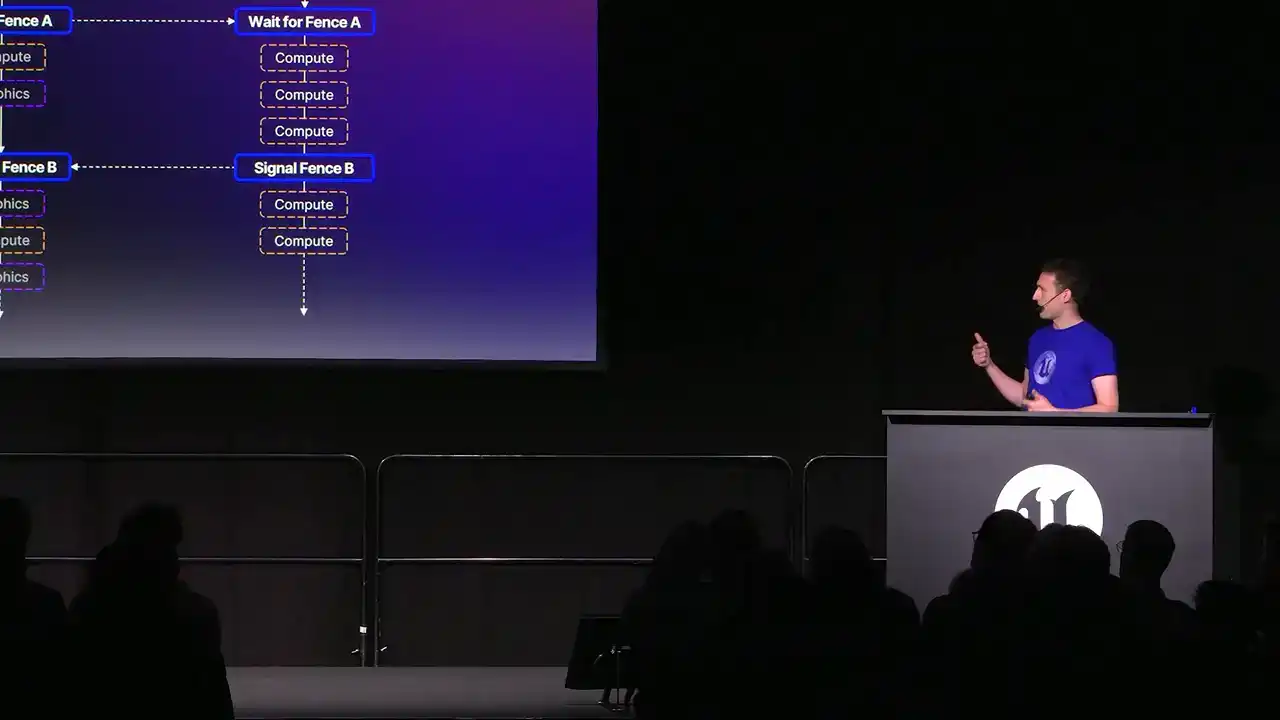
you can end up with execution pauses. And you can see that on the left-hand side, where there's that gap just before the wait for fence B. So because the queues are synchronizing with each other,
you can end up with these kind of bubbles on the queues. And that's something important to be aware of when we're looking at the profiler.

So moving on to the actual profile itself and the improvements that we've made in 5.6. Hopefully, you're all familiar with these tools. They've been around for a while now. The three main components of the GPU profiler are stat GPU, the profile GPU command, and Unreal Insights. In 5.6, we've rebuilt these from the ground up to be based heavily on our RHI breadcrumb system. I'll touch on what our RHI breadcrumb system is further on in this talk. And one of the key things here is that it now all draws from a unified data source. So all of these tools now agree with each other. Perhaps previously, you might have noticed that some of the stats were off by fractions of milliseconds. Because they're all drawing from the same information now, they all agree with each other.
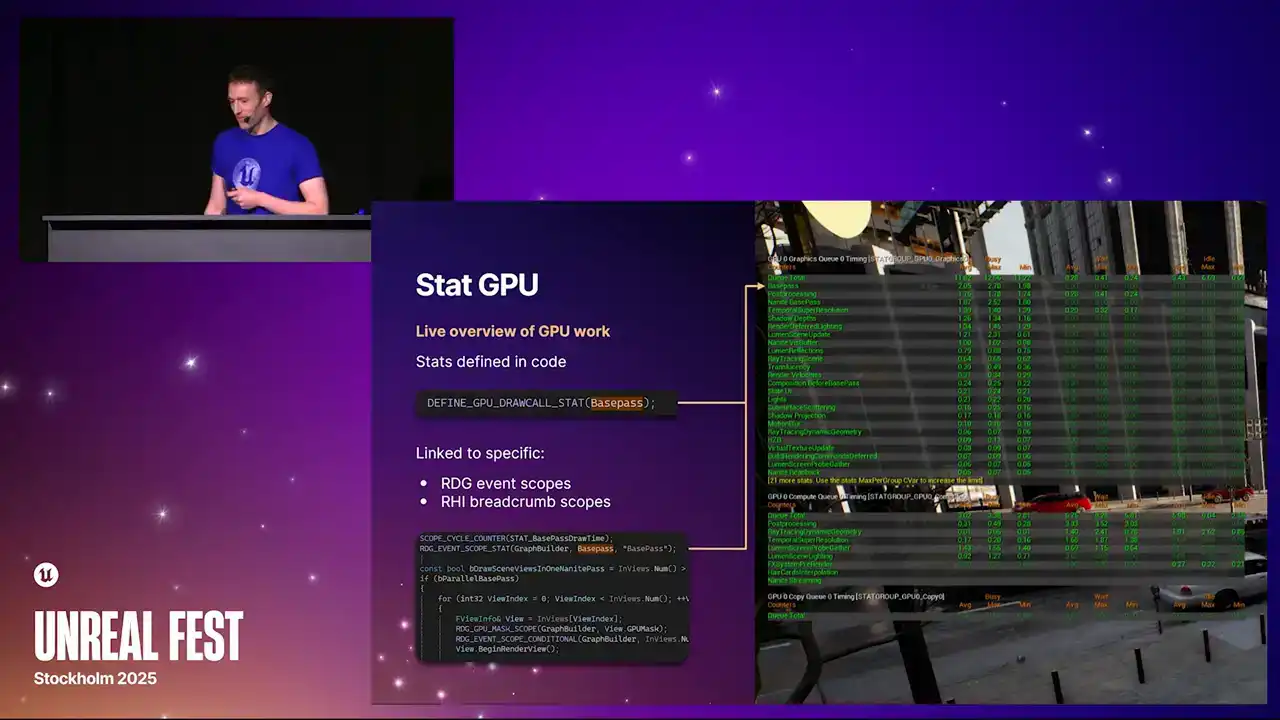
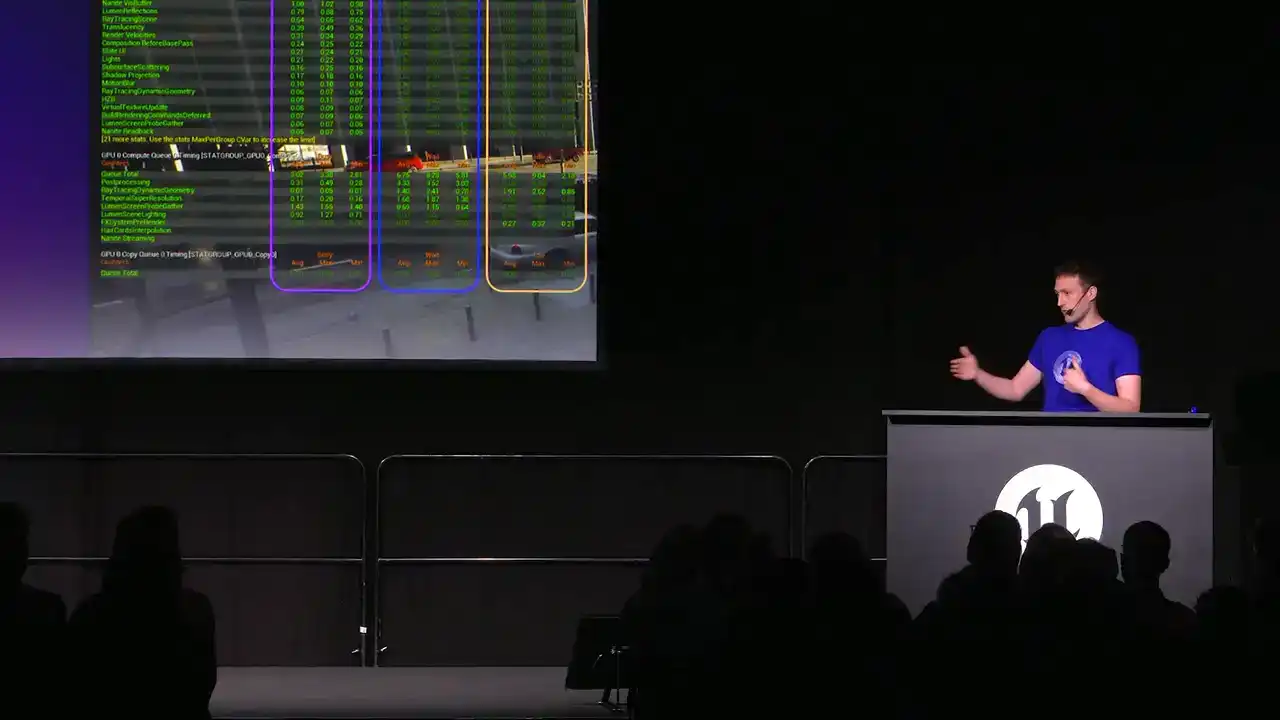
So statGPU. This is a tool that you can use to give you kind of like a live overview of the GPU work that's running in the frame. You can bring this up on console. You can bring this up in the editor. Each one of the lines here is a single stat, and the stats are defining code. There's an example macro for the base pass there. And the individual stats get attached to specific render graph event scopes or RHI breadcrumb scopes. And then all of the rendering that happens within those scopes gets attributed to these stats. And something important to note is that these stats can appear multiple times in the renderer. And they, so like, for example, I think the post-processing one is an example where there's actually multiple places in the renderer we tag with post-processing.
And then the stat, the data that you see in stat GPU is an amalgamation of that. So kind of we accumulate in some results.
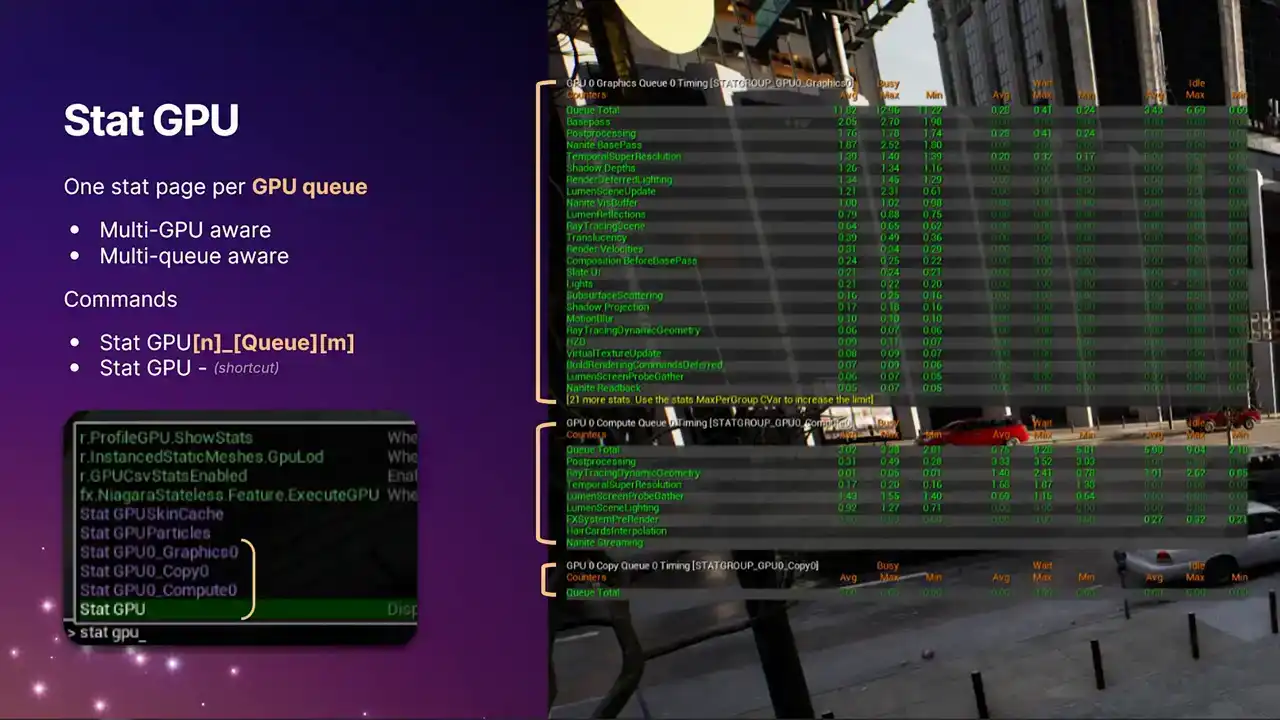
So for the first time, we are now multi GPU aware and multi queue aware. This was the big change in 5.6. Previously with stat GPU, you'd only get the single graphics pipe of your first GPU. So if you're running in a, if you're running ASIN compute, you'd never see the information from ASIN compute.
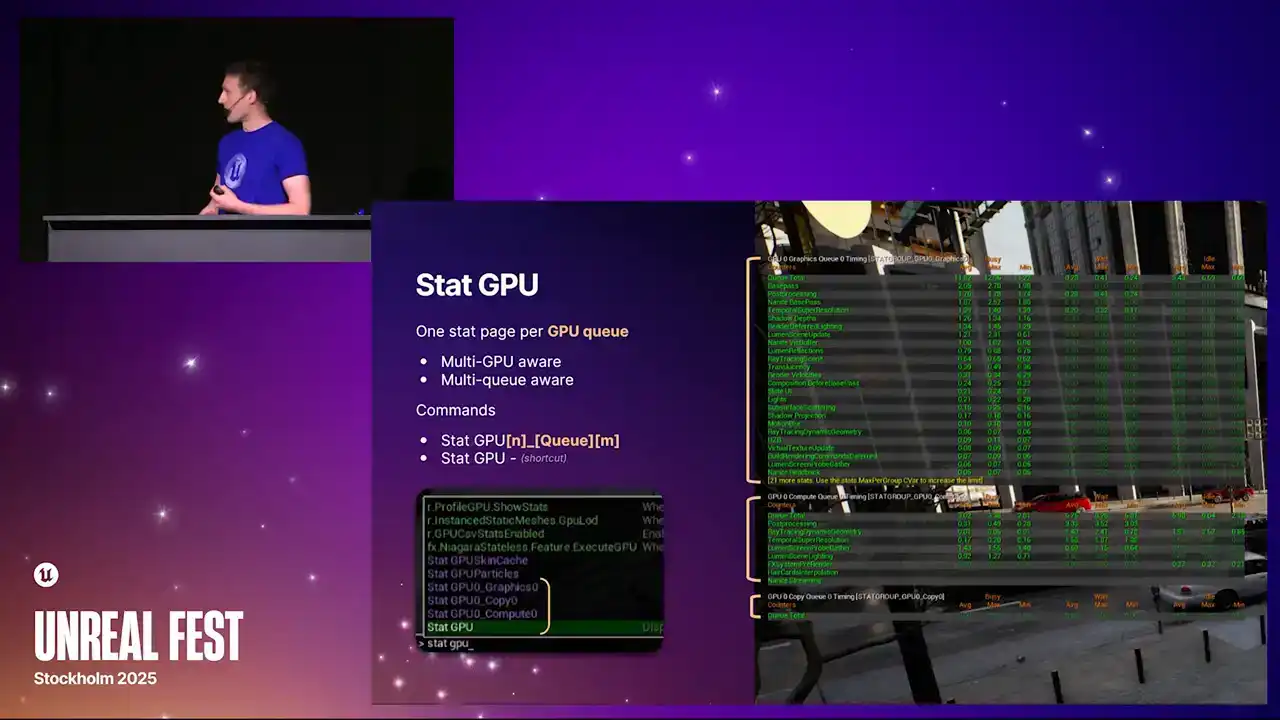
or if you're running a virtual production scenario with multiple GPUs and so on, you never got the information about those GPUs. Now we get all of it. And so each of these stat pages that are highlighted with the brackets,
they're all actually independent stat pages. It just uses the standard Unreal stat system. And you can bring them up individually with the longer format commands, stat GPU, and then the index, the queue type, and another index.
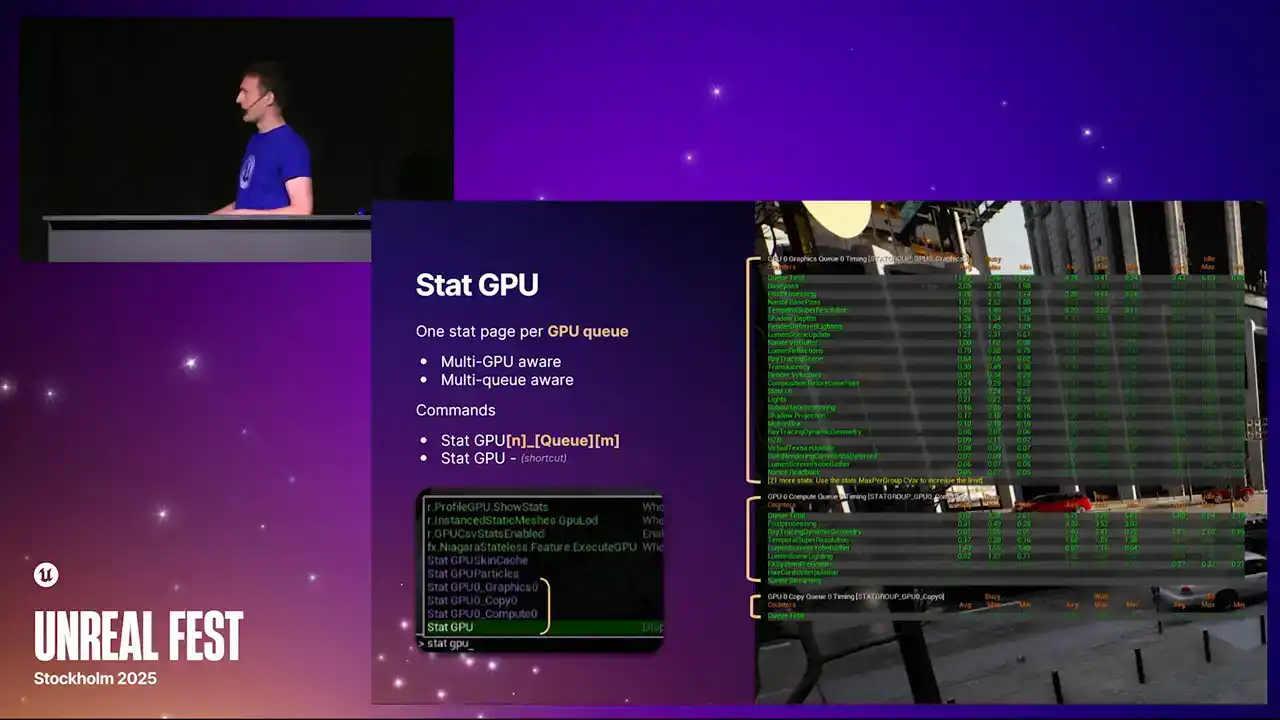
It's all built so that we can in future support potentially more than one compute queue. But at the moment that just the one But we also repurposed the standard stat GPU command which is just like a macro command now It toggles all of them on and all of them off So if you've got muscle memory of typing statGPU, then it will still work as it did before. But the actual data that we present now has been greatly expanded. We now have these three separate columns. The one on the far left is what you used to see before. It's the busy time. It's the time actually spent doing useful work running command lists, running shaders.
The middle column on the right are the two new ones that we've added. The middle column is the wait time. And going back to that example I gave during the recap,
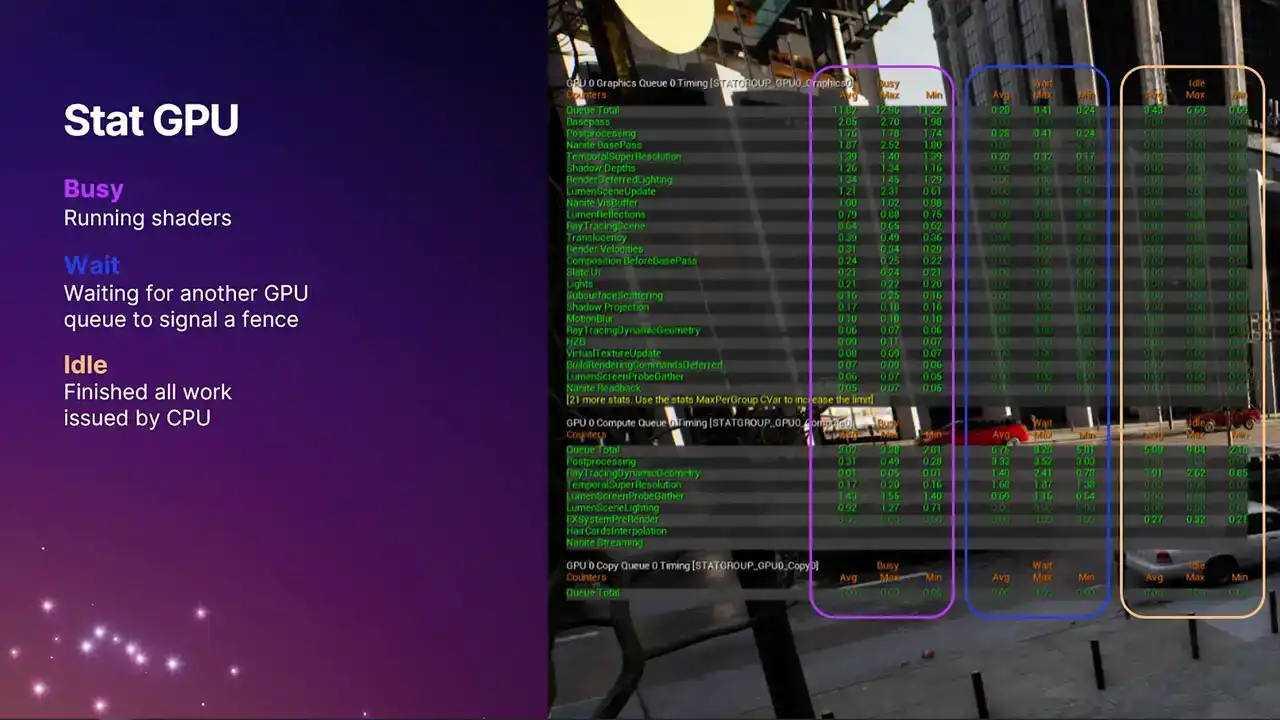
that's the time when one queue is waiting for another queue to signal a defense, and therefore isn't running anything useful. You may find that generally the compute queue, you'll see larger non-zero values, because it's not always a win to run something on the compute queue, because it depends on what is overlapping with on the graphics queue. Portions of the frame on the compute queue
is just idle, waiting for fences to signal, waiting for the data dependencies to be resolved. So it's not necessarily a bad thing if you see lots of wait time on the compute queue.
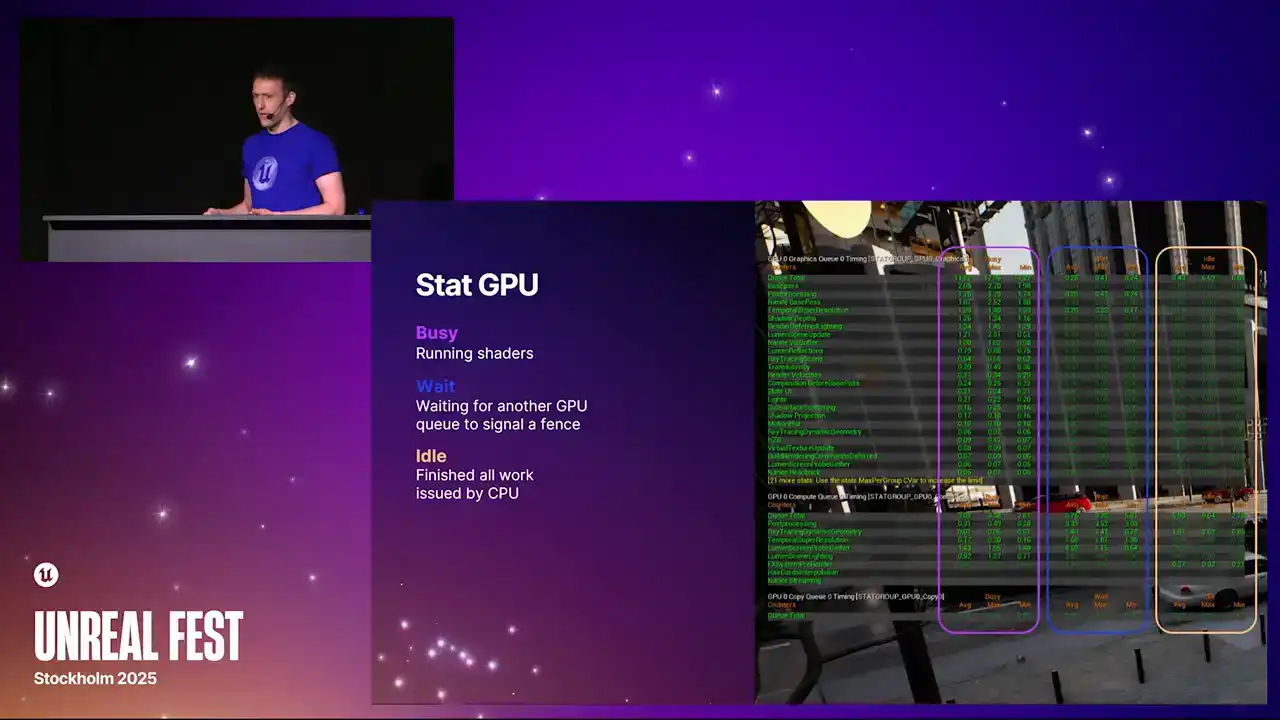
However, the graphics queue, we tend to try and keep busy all the time. So generally, the numbers there should be closer to zero. And then the column on the right-hand side is idle time. We've never had a stat like this in Unreal Engine before. This is really cool. Because we know exactly when the work gets submitted. So in modern APIs like D3D12, we know exactly when the work gets submitted to the driver.
We know exactly when the GPU is completing the work. We can now see that the GPU has gone idle because it's run out of work from the CPU. So a non-zero value here means that the GPU has actually completed all of its work and has gone idle because the CPU hasn't given it anything further, which is a good indication that your title is at least partially
CPU bound for that duration of the frame. So if you see non-zero values here, Be sure you're running in a test build or something with good cp perf, otherwise it's not very representative. But if you do see non-zero values, that kind of warrants some further investigation with Unreal Insights or other tools.
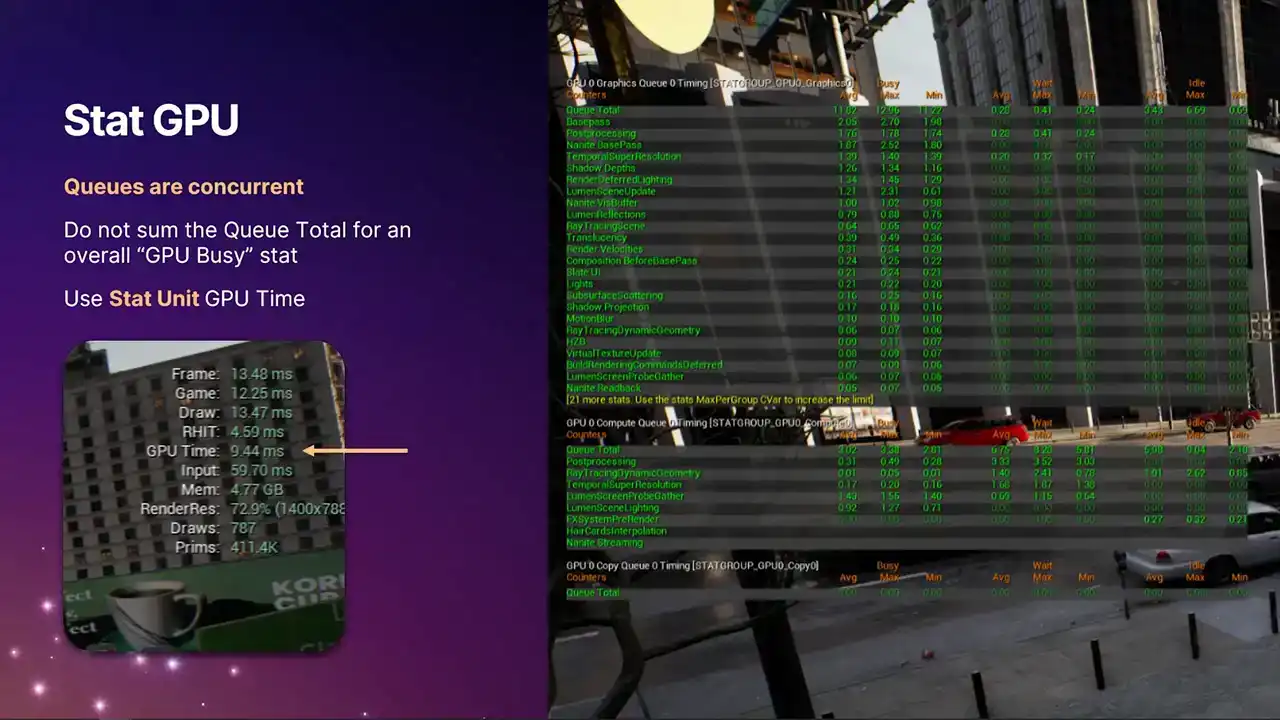
And one very important thing to note is that because the queues are concurrent, you can't just add up these numbers across the queue pages. That wouldn't make any sense. Each of the stat pages have a queue total stat, which is the one at the top, which gives you the total amount of work in each of the columns for that frame. But if you're looking for an overall GPU stat time that tells you the ballpark figure of how long the GPU took for the whole frame across all queues, you need to be using the stat GPU time for that, which is the one highlighted with the arrow. We compute this stat by taking a union of all the busy times across all of the queues. And then that goes into that final stat time, which is for the frame. And that particular stat is the one that drive systems like dynamic resolution,
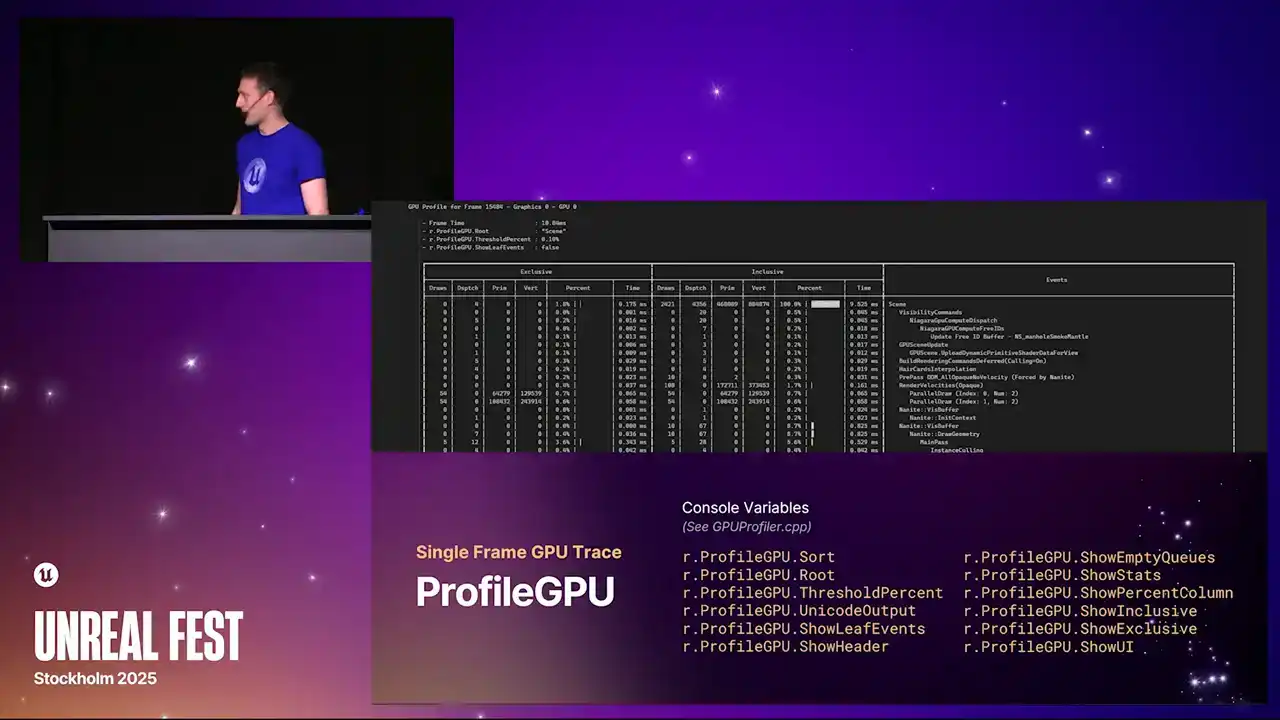
because we need a single stat to say how expensive the GPU is this frame. And then we can scale things up and down with that. So moving on to profile GPU, you may have already
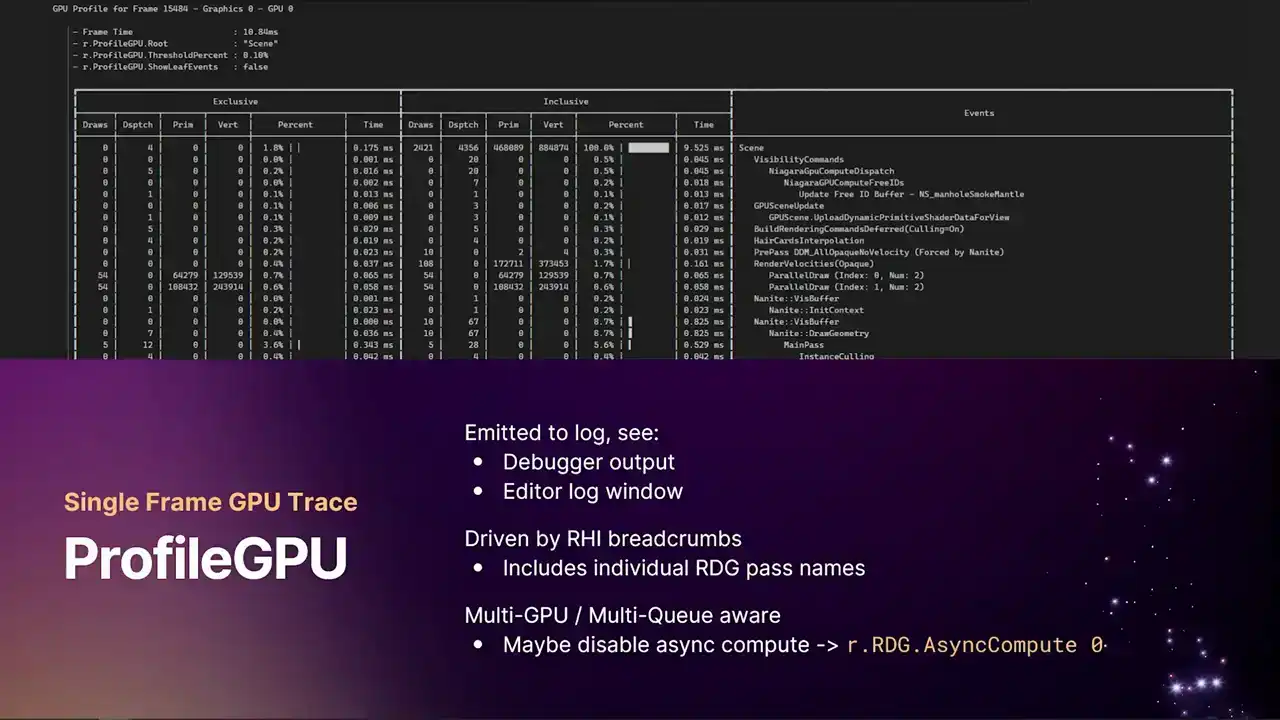
seen this command before. It's a command you can run in the in-game consoles. It produces a text log that goes out to either the UE log. So it's either into the debugger output window, if you've got Visual Studio attached, or the editor log window, or the log file itself. It gives you a table, nice view breakdown of absolutely everything that happened in the frame. And again, it's driven by our RHI breadcrumb system that I'll come to later. And this will include all of the individual RDE pass names. So there's a couple ways you can use this. I use this sometimes just to check if a certain pass is even running. It's quite a handy command to just throw into the console,
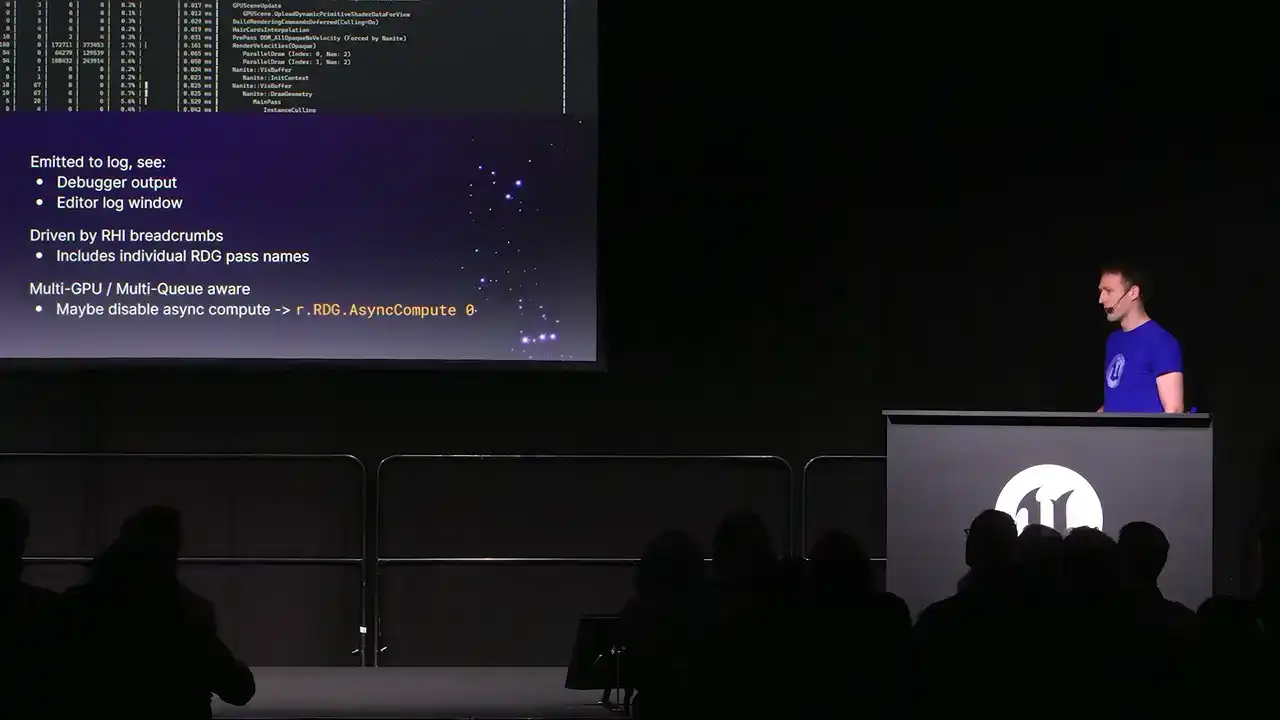
see the output log, and go, oh, yeah, this particular post-process pass is running in this frame. But of course, it gives you all of the stat breakdowns. So we have, for the first time, we now show both exclusive and inclusive timings.

I think previously we only showed the inclusive timings. And also, again, as the kind of theme with the changes that we've made here, we're now also multi-GPU and multi-queue aware. So you get one of these tables per GPU per queue. So if you have async compute enabled, you'll get two tables. You'll get one for graphics, one for compute.
But if you're trying to use this tool to focus on a particular render pass, a particular shader to kind of optimize and tune things, it might be best for you to turn off async compute without the Cvar r.rdg.async compute 0.
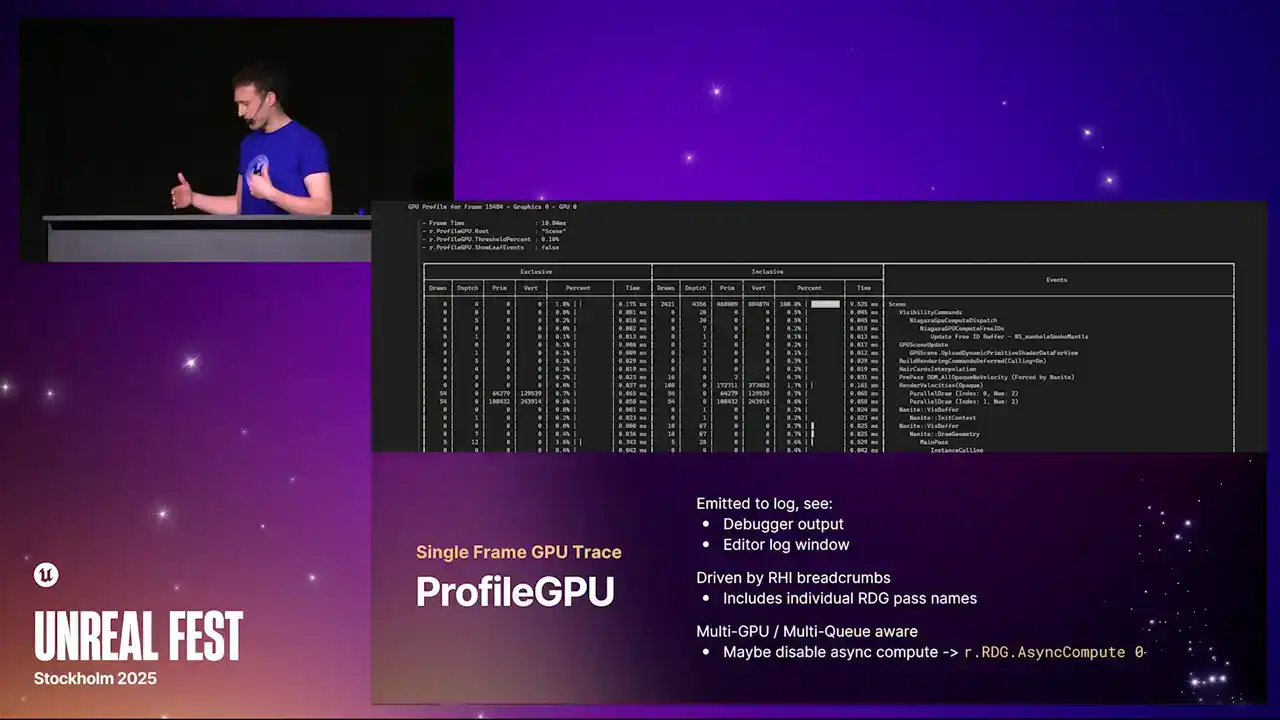
The reason for this is because as compute work overlaps with work on the graphics queue, they can affect the timings of each other because they're sharing execution resources. So if you're trying to focus on a specific pass, it's worth turning that off. When you turn it off, everything will fall back to the graphics queue, and then everything kind of lines up. There's a whole chunk of console variables that you can use to filter this table and show and hide columns that you don't want to see. In this particular screenshot example I have at the top, I've actually filtered the tree down to just the scene node. And you can do that with the r.profileGPU.root console variable. It just takes a string, and you can put wildcards in, and it will show you only the event names that match that. So if you're focusing on, say, post-processing,
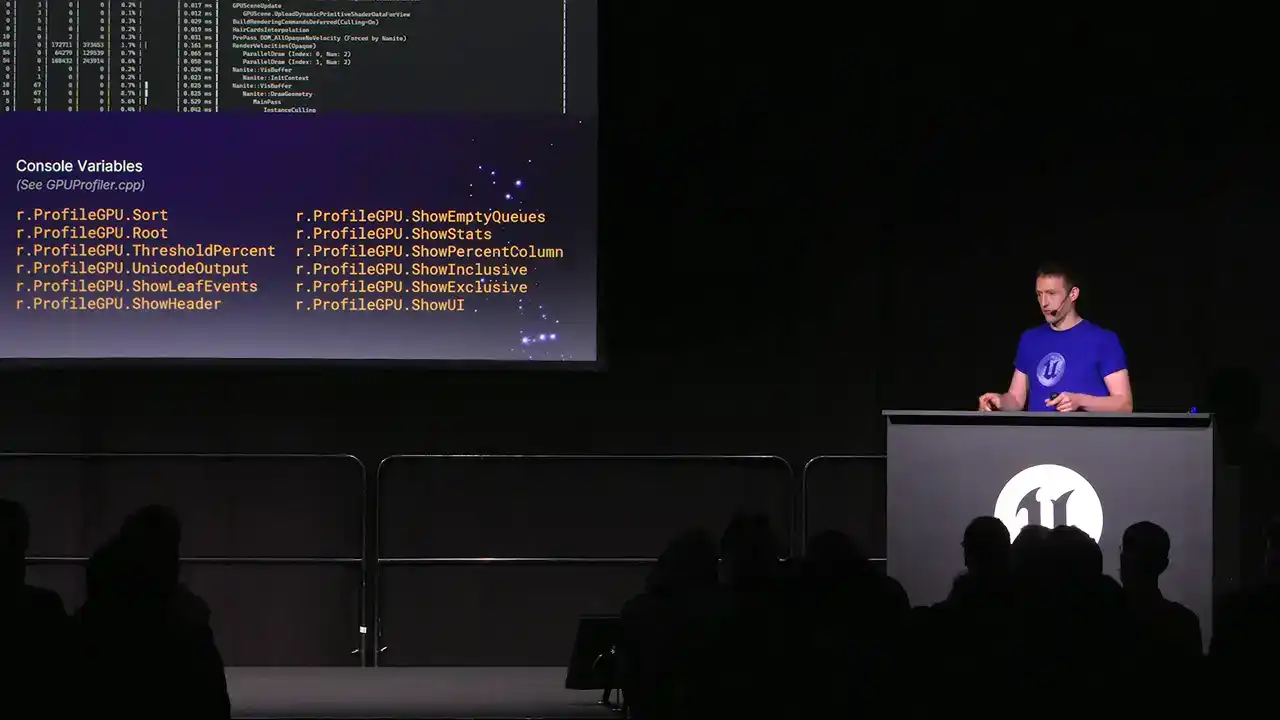
then you can just set the route to post-processing. You only get that section of the table visible. One other important thing to note, some text editors don't handle Unicode fixed-width characters very well. So those kind of pretty bars that we draw now to show the relative timings, some text editors just
can't handle that, and it's all out of alignment. So if you find that, I'd either recommend changing a font to one that can handle those characters,
because then you get the nice table view But otherwise you can set that output cvar to 0 and we fall back to just ASCII characters and then the table should line up properly
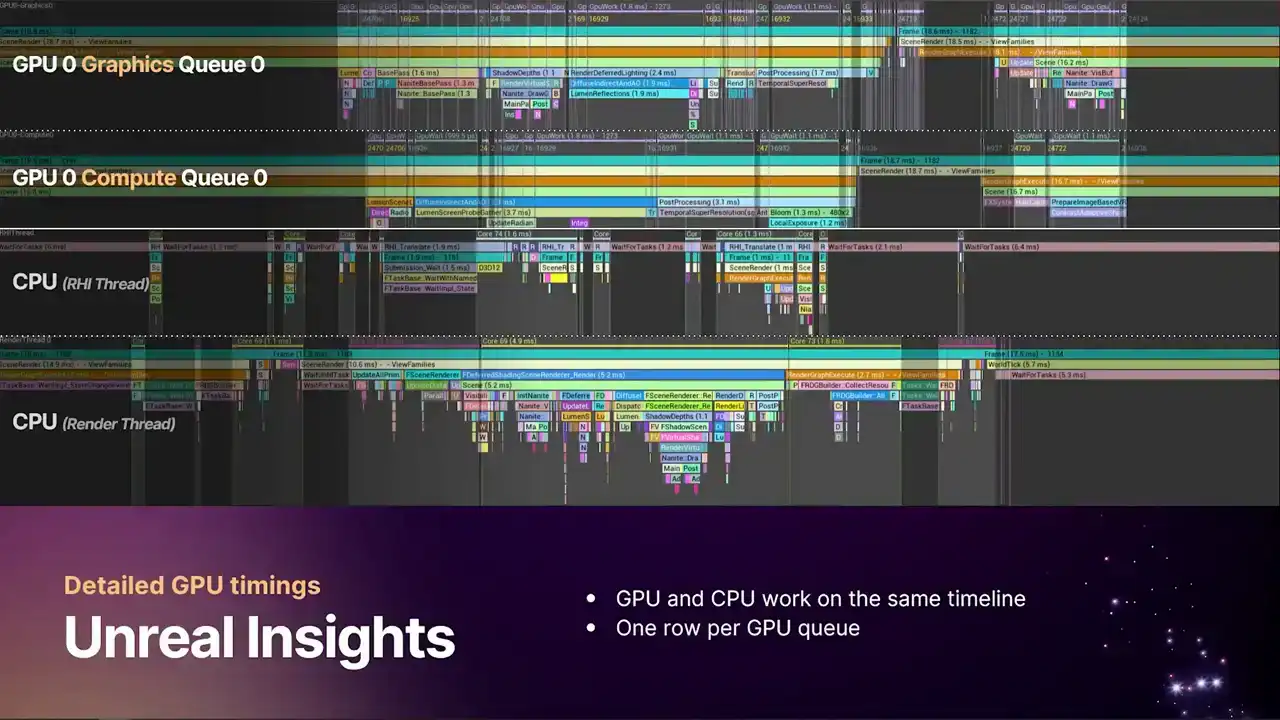
OK, so moving on to Unreal Insights. Hopefully, you've all been using this tool to profile the CPU. But now we've greatly enhanced our GPU capabilities in Unreal Insights. Again, as with the theme, we're now multi-GPU aware and multi-queue aware. So we have one timeline per queue per GPU.
And these queues are aligned correctly with the CPU as well. So you can see the motion of work from CPU into GPU and back again and see where the weights are happening if you have bubbles in your pipeline and that kind of thing.
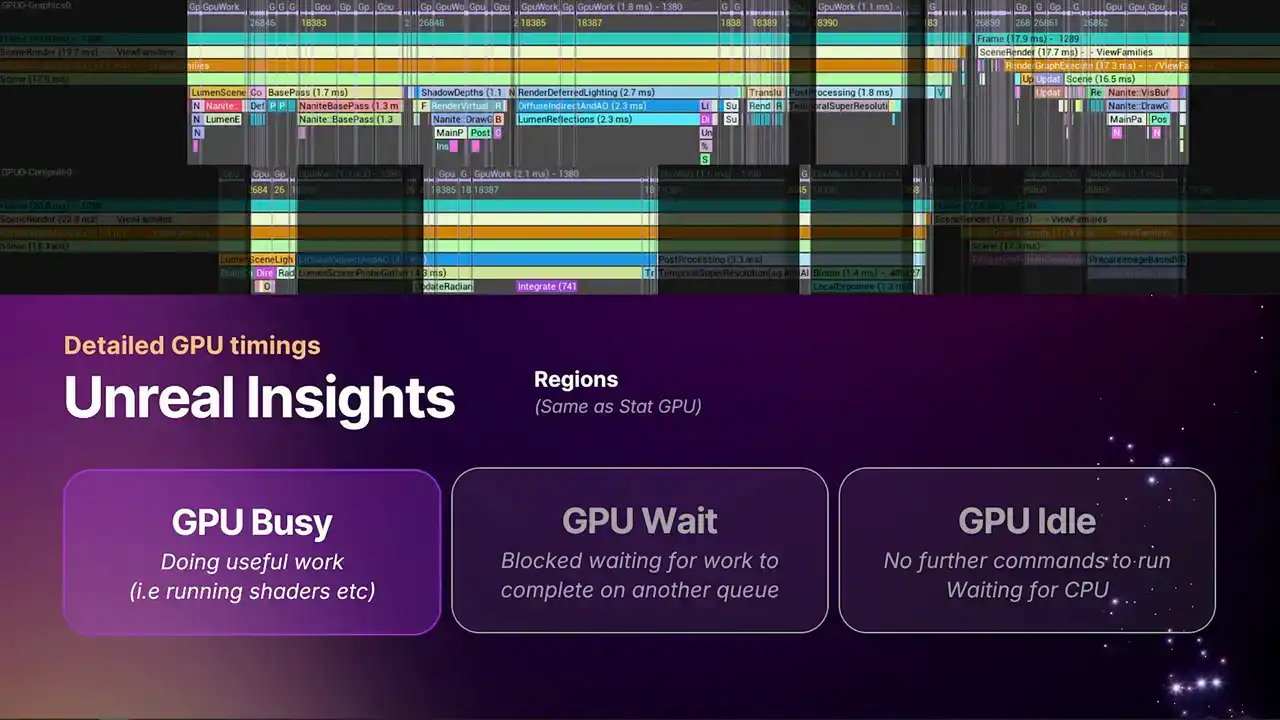
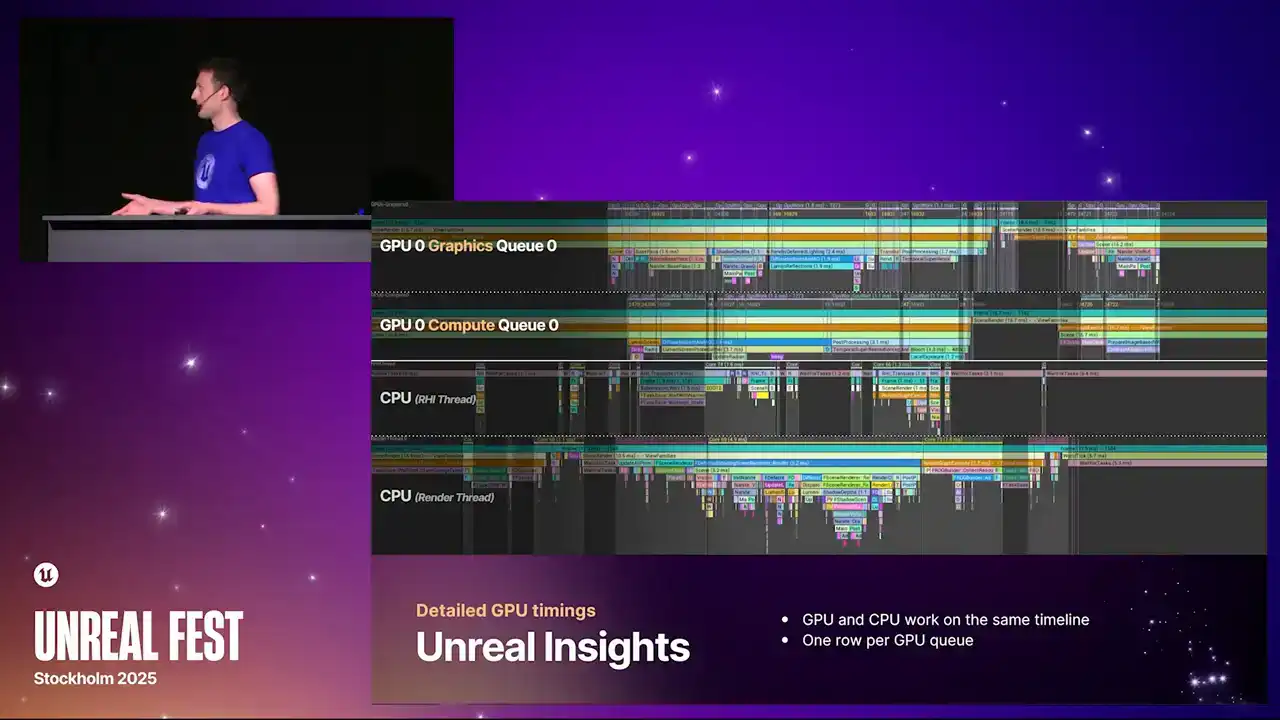
And maybe some of you are familiar with the context switch data that you can get in Unreal Insights, which you see on CPU threads that tell you exactly when the thread is actually scheduled and running. We have something similar now on the GPU. So we're able to, with the extra information we get from the new profiler, draw these regions that highlight exactly when the queues are running and when they're waiting and when they're idle.
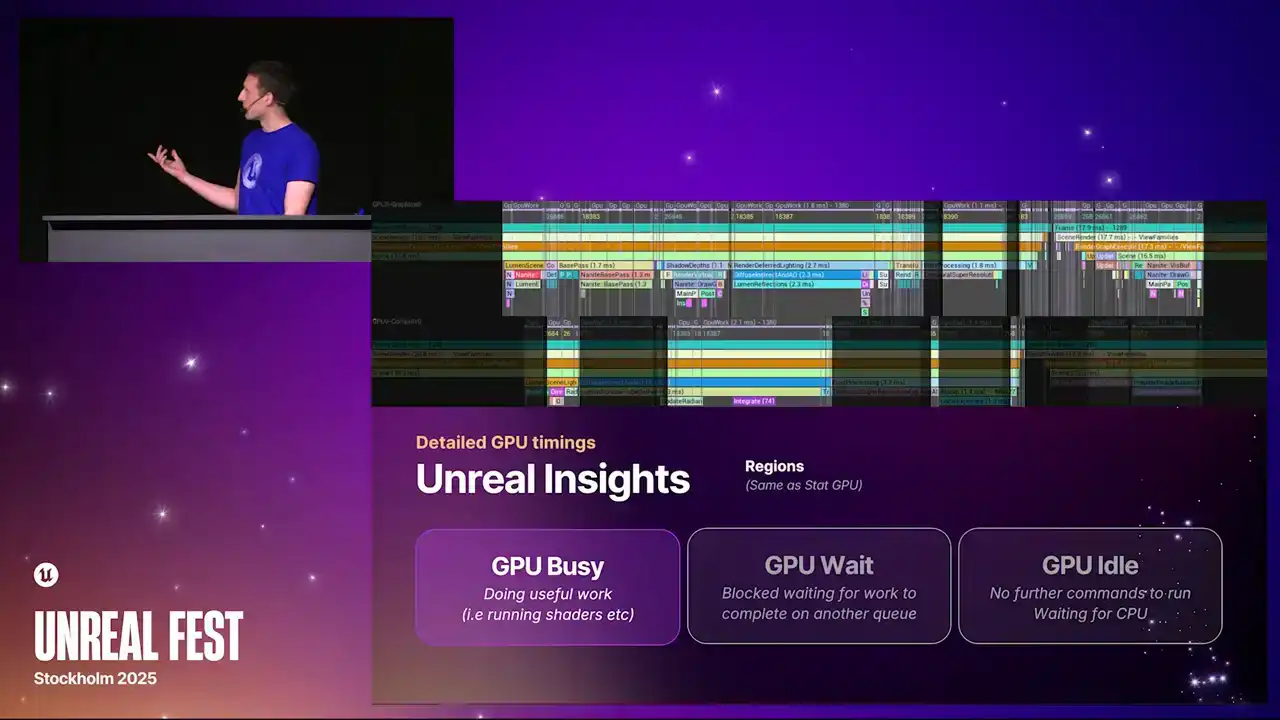
So the highlighted regions on the timeline at the top currently are the regions where we're doing the GPU busy work. And this, again, is the same stats that you get from stat GPU. It's literally these regions that we're summing up to produce that data. And then the highlighted regions here are the GPU weight regions where the queue is blocked. And you can see here, the lower line is the async compute queue. And you can see that there's just more weight work happening there, because that's just generally what async compute does. And then finally, we have the kind of grayed out regions that don't have any marker above them. And that's the idle regions, the places
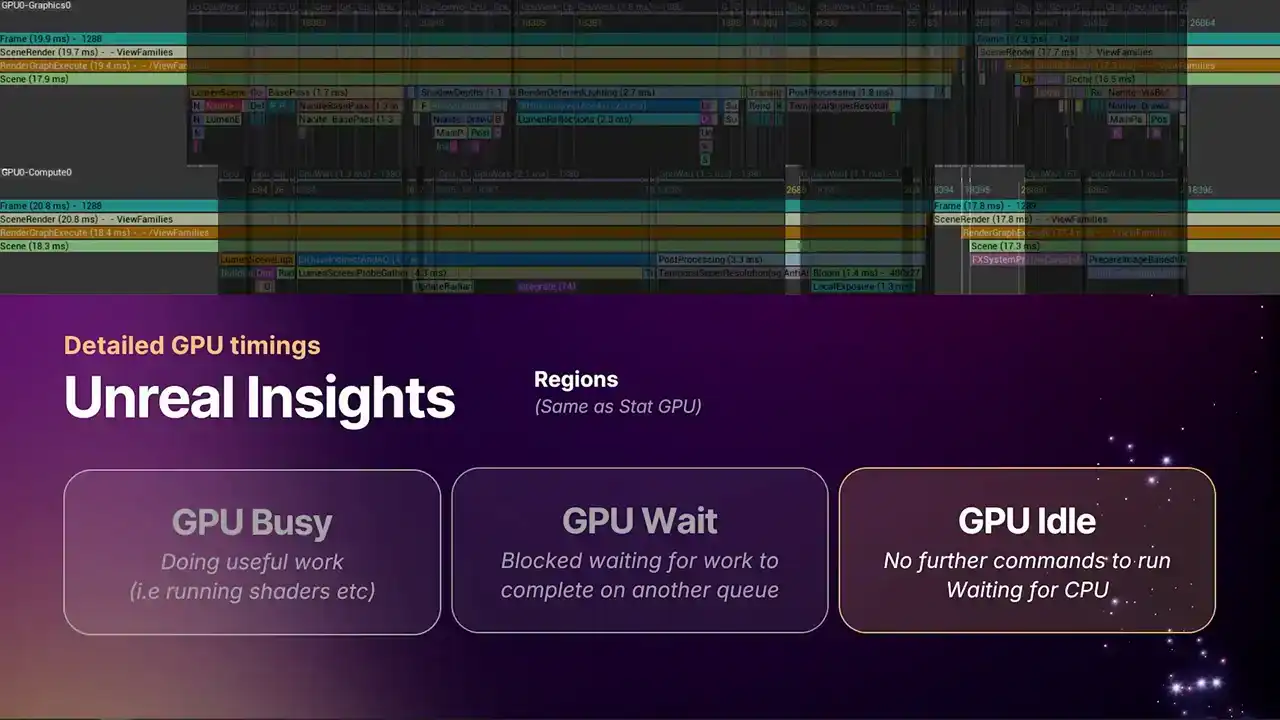
where the GPU has stopped, because there's nothing further for it to do. The CPU hasn't given it any more work to do.
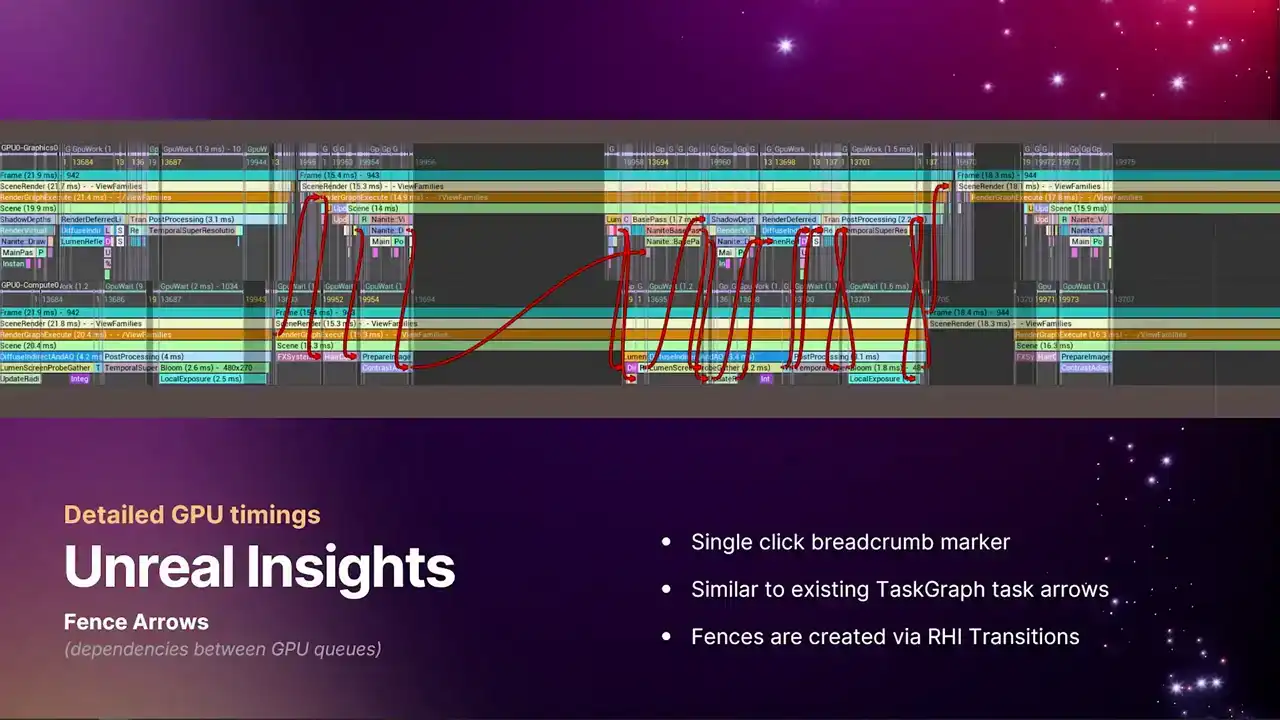
So we've also added similarly to the tasks channel on the CPU in Unreal Insights, we now have these fence dependency arrows. You can bring these up by just single clicking on one of the markers, like the frame marker. So yeah, the screenshot I have here is just single clicking on the frame marker, and it shows all of the weight dependencies between the two queues. And each one of these is a fence that is getting signaled and weighted upon,
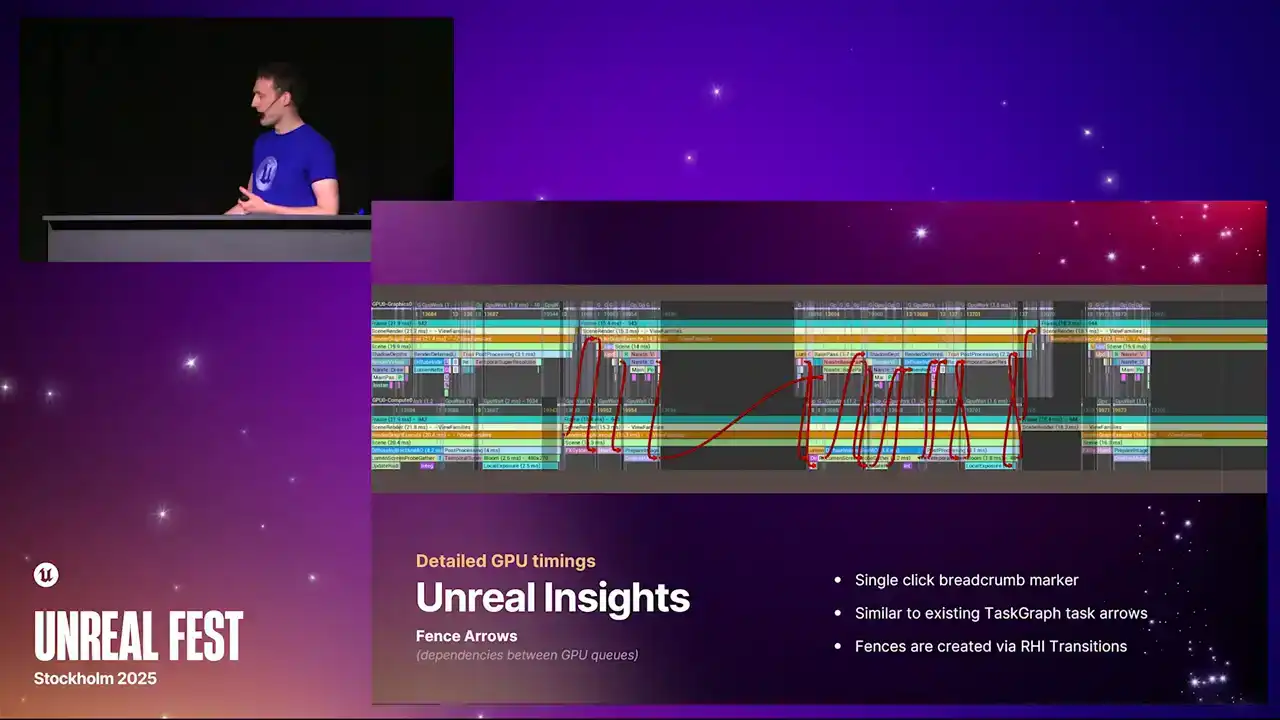
And it's the thing that is driven by our RHI transition API. Not an API that you generally need to deal with, because RGG deals with all that stuff for you. But as RGG knows that there's a data dependency between certain passes, then this is when we get these fences. But of course, this is quite a busy view to look at. So if we zoom in and just look at a single example
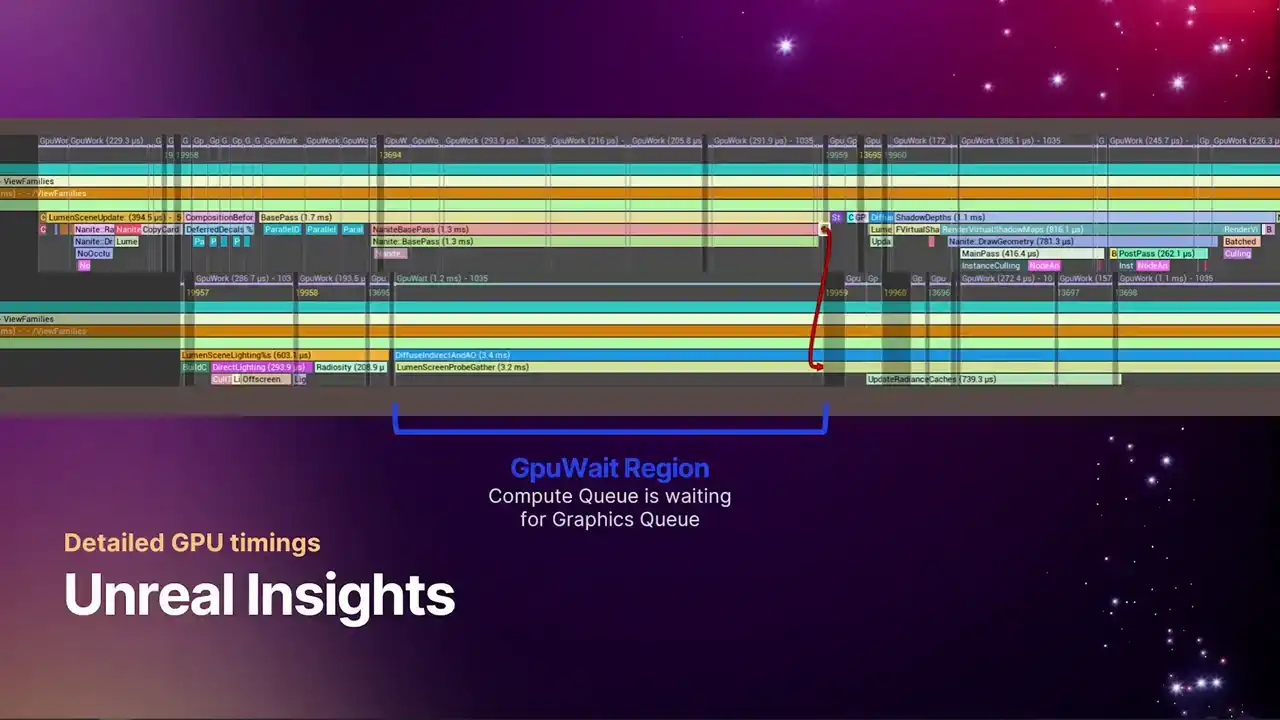
of one of these arrows to get a feel for exactly how they appear on the timeline. The top line, again, is the graphics queue. The lower line is the compute queue. And here we have some Nalite base pass work that's running for several milliseconds, and a region where the ASIN Compute Queue is just waiting for graphics to catch up. So if we zoom in a little further, this is that same arrow. So we have that region in the top left corner where the graphics queue is doing the busy work. And as soon as that busy work completes, we signal the fence.
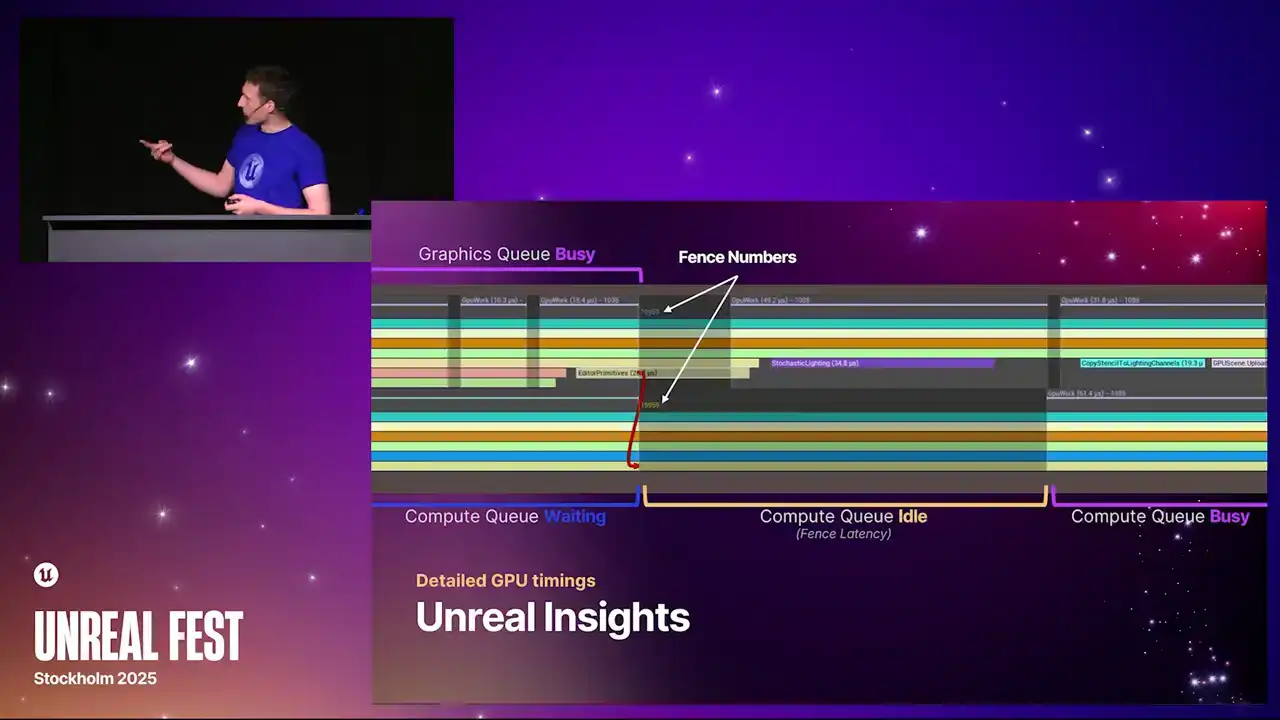
And that's denoted by these two matching fence numbers. They appear just below the markers on the timeline. And these are the indices of the specific fence. They just increment along the pipes So the very first fence ever submitted is index one. And it shows you exactly where the fence is signaled
and where the fence is resolved, because that might not always line up exactly. You could signal a fence much earlier, and then it gets weighted on much later, just the way things line up.
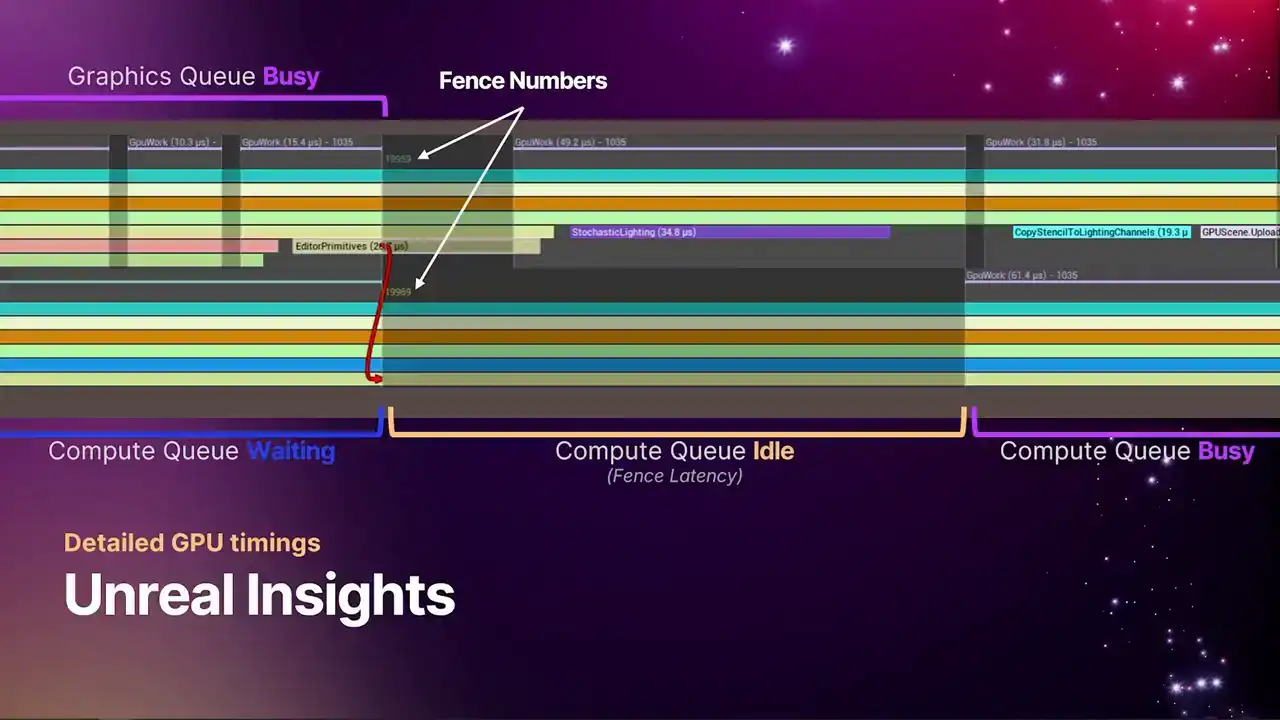
So you can see here, the fence gets signaled. The compute queue goes from a waiting state back into an idle state, because there's always some amount of latency that's associated with signaling a fence. But after a very short period of time, you can see the compute queue springs back into life, and we get back into a GPU busy state.
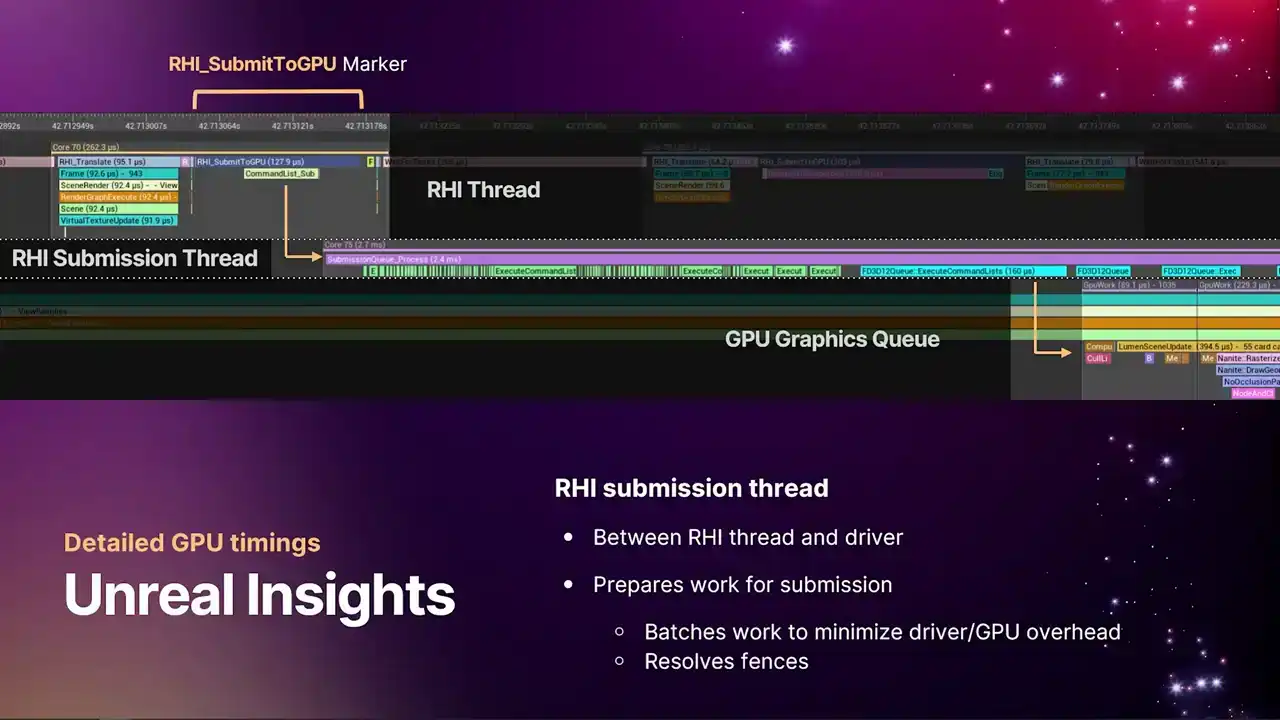
So as I mentioned before, since we have the GPU queues aligning correctly now with the CPU timeline and insights, we can get a lot of information from the flow, the kind of pipeline of data into the GPU. So one thing that's worth mentioning, a lot of our platform RHIs now have an RHI submission thread. And this is a thread that sits between the RHI thread and the GPU itself and the driver. Primarily, it's used for batching work together to reduce GPU overhead and driver overhead, so we're just making fewer calls into the OS. And it's also the thread that resolves fences.
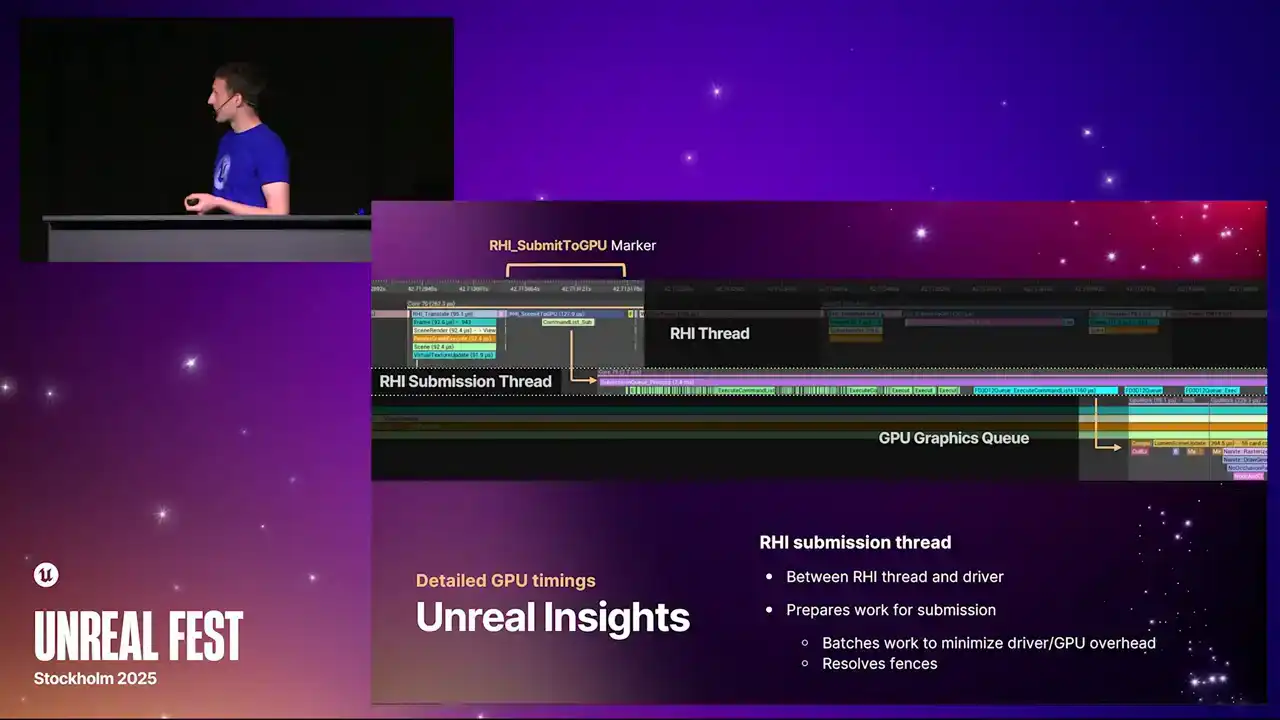
So in the example, again, on the timeline, the very upper left corner, we have the RHI thread with this RHI submit to GPU marker. That marker is the place where we take the work that we've produced in the CPU threaded side of the renderer and hand it down to the submission thread.
The submission thread runs for some amount of time doing this batching work and resolving the fences. And then eventually, we hit that blue region on the right, which is where we actually call into the OS. And then you can see the GPU queue springs into life immediately afterwards.

And similarly to the submission thread to get where work is flowing into the GPU, we have another thread that's monitoring work completion on the GPU to then signal the rest of the engine. We call this the RHI interrupt thread. It's basically just one thread that sits and waits on fences to see the work that we submitted to the queue, know when it's completed, and then goes and signals the rest of the engine. And one thing to note is that generally, we have one of these threads, but it actually handles all of the GPU queues.
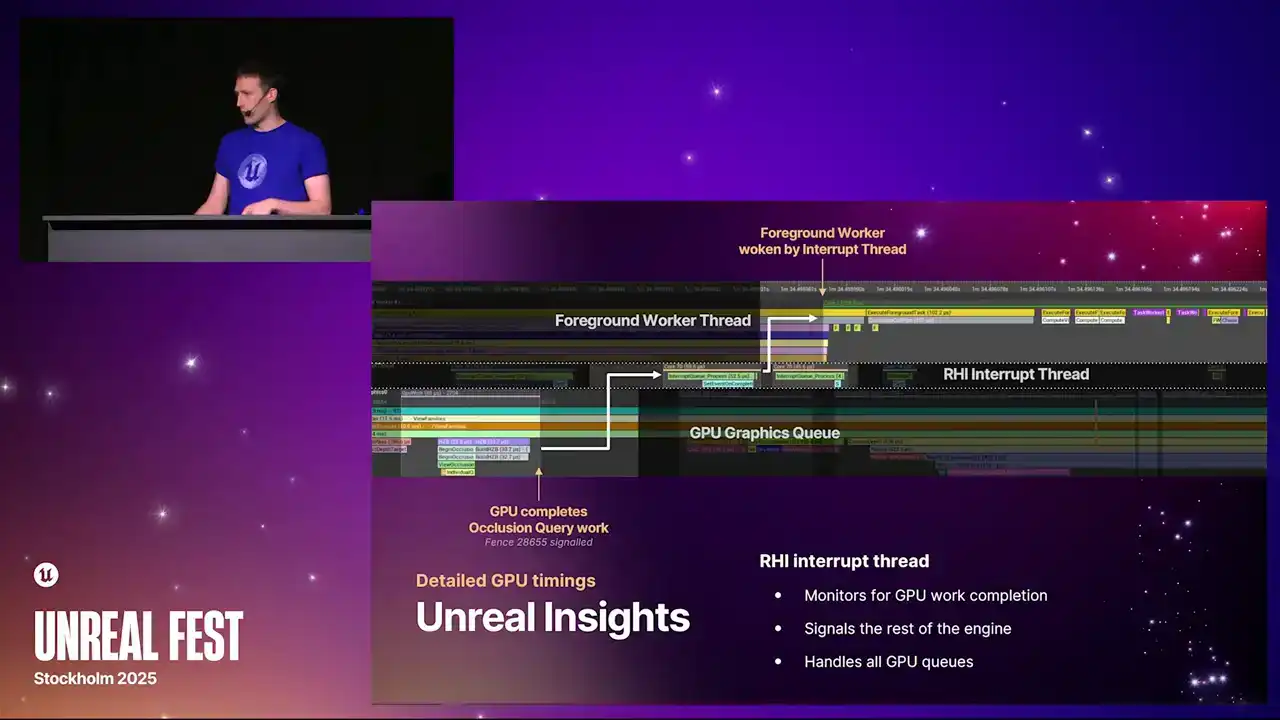
So you'll see this thread wake up whenever any one of the queues complete some work. So you'll see them kind of springing into life. So in the timeline example, this particular example is occlusion queries. So the very bottom left corner, we have the GPU doing occlusion queries for the previous frame.
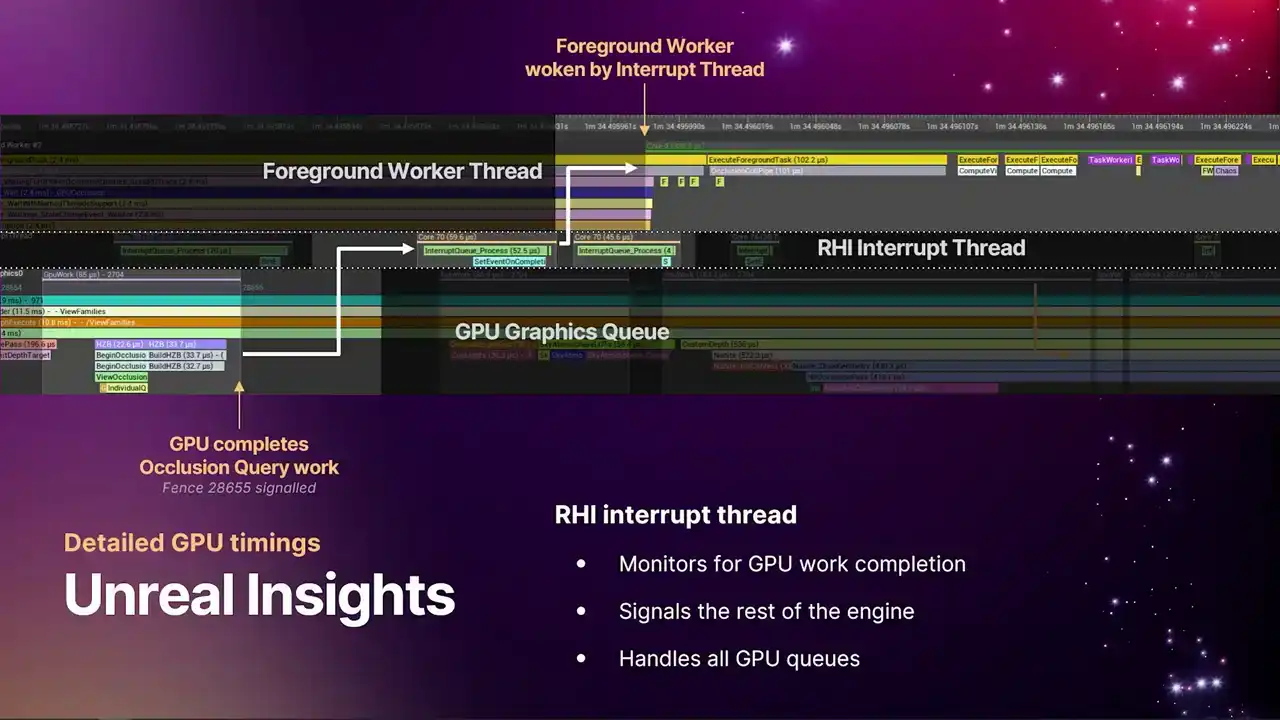
And then in the top right on the foreground worker thread we have the code in the renderer that doing the end pass the scene visibility pass that wants that data back and it waiting on the occlusion query results from that frame So the GPU completes the work signals events there a little fence number you might
not be able to see on the slide, but where that arrow is pointing. The fence gets resolved, it wakes up the interrupt thread, the interrupt thread pulls the queues across all of the GPU to know what work has just completed, sees that it's this particular piece of work that's completed, grabs
the event and fires it into TaskGraph, which then wakes up the TaskGraph. So with this flow of data, the RCHI submission thread, the RCHI interrupt thread, and then the alignment of the timelines, you can now use insights to really know where your bottlenecks are, where your bubbles are, and you can do analysis of the pipeline all the way back
from the GPU all the way through to the render thread, which is super powerful, super useful. So that covers the improvements we've made to the new profiler.
I'll move on now to talk about our new RHI submission pipeline, which shipped in 5.5.
And in this section, I'm going to be focusing primarily on the RHI API itself. Day to day, this isn't an API that you'll be directly using.
Generally, if you're writing renderer features these days, you'll be using render graph. So some of the details here are real low-level stuff inside the RHI, but it's still very useful to know about this
if you're doing performance analysis and you're looking at insights and trying to work out where your bottlenecks are, where your threading is going, that kind of thing.
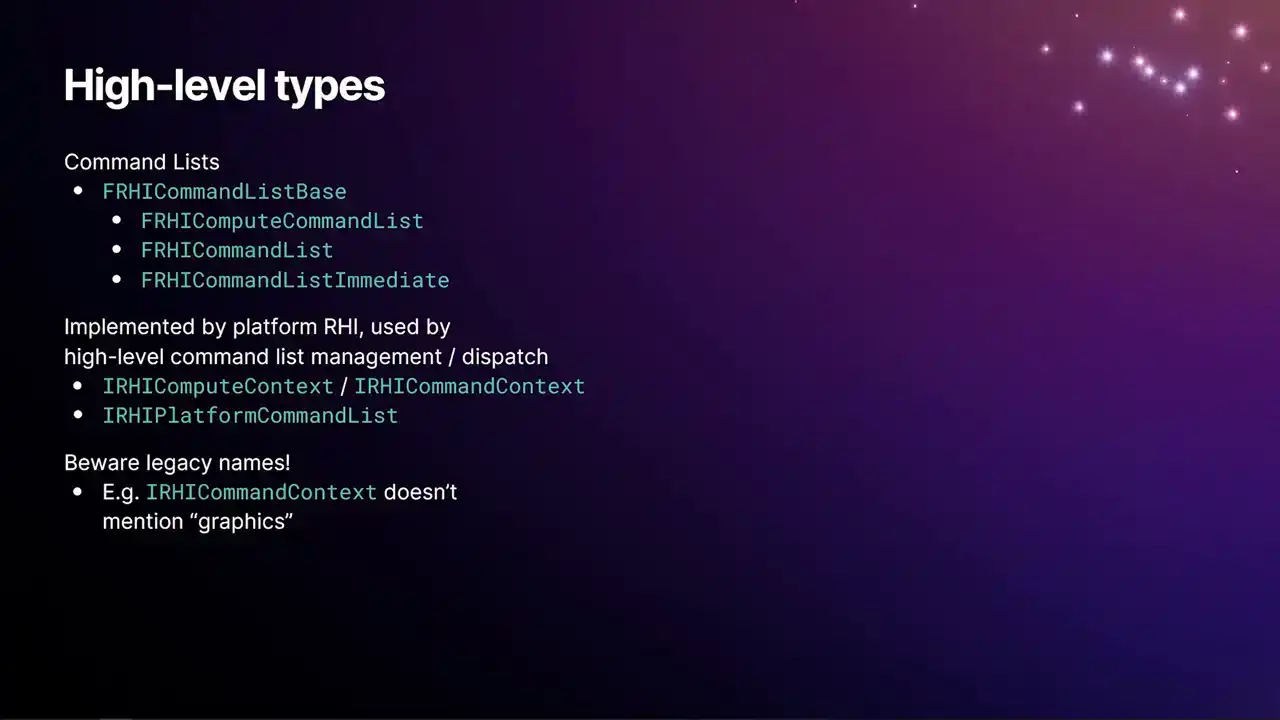
So I'll start by just defining a few high-level types that you'll see in the code. We have the frhi-commandlist-based type, which has most of the implementation for recording RHI commandlists. And then the three derived types from that, which are just mostly adaptor classes that give you access to things like the draw call API, the dispatch API, and so on. And the special case in there is the RHI command list immediate, that last option there. The immediate command list is a singleton in the engine that's owned by the render thread, and is kind of the primary entry point into the pipeline for submitting work to the GPU. We also then have the types that are implemented per platform RHI. So there's these base interfaces that are then implemented by each RHI module. The main one there being the RHI compute context and RHI command context types. The contexts in the RHI are the objects
that are involved in converting the recorded RHI commands from the renderer into the actual GPU commands that run on the hardware. So it's within the context that we're calling it to say D3D12 and actually producing D3D command lists. And those produced D3D command lists end up getting wrapped in this IRHI platform command list type, which is used just for the management and the submission pipeline.
And one thing to be aware of, we have lots of legacy names around this stuff because this system has been around since the early UE4 days, maybe even UE3. So the IRHI command context is specifically for the graphics pipe, but it doesn't mention the word
graphics in it, even though we have a compute context called IRHI compute context. So yeah, I'm sure one day we'll be renaming these, but it hasn't happened just yet.
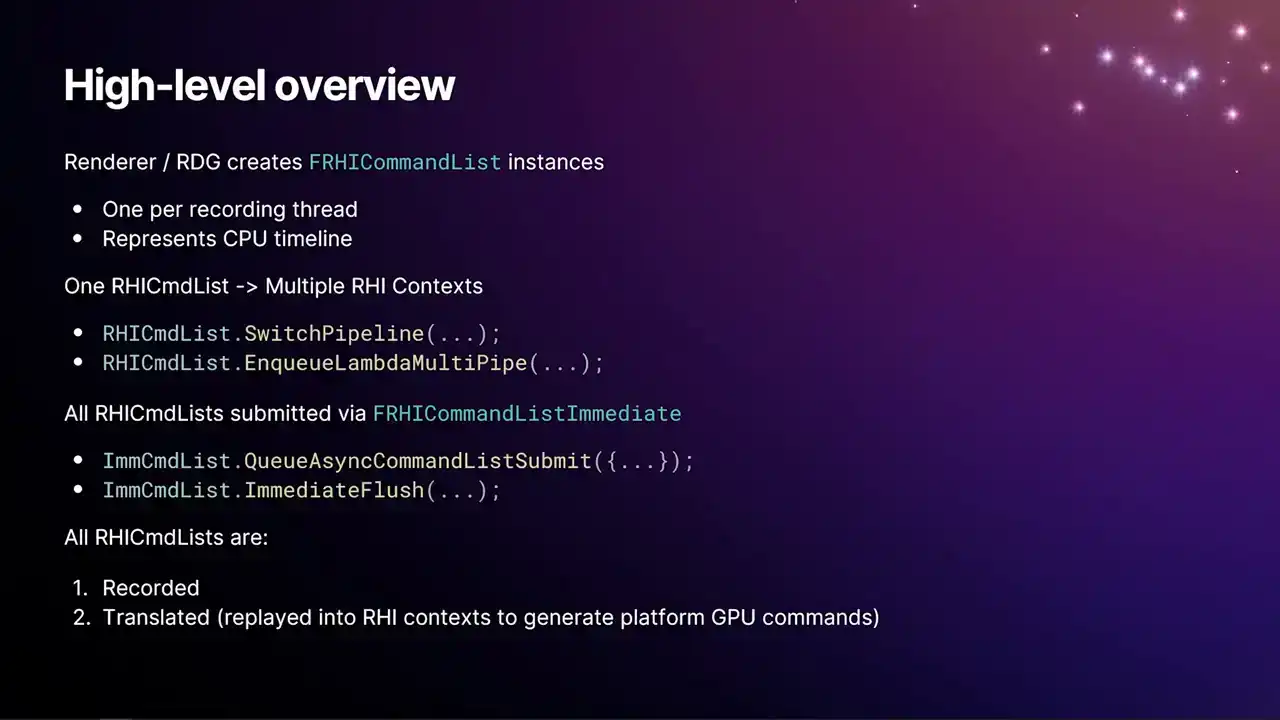
So as a general kind of high-level overview of how this process works, the renderer and render graph creates instances of FRHI command list. There's one of these per recording thread, and the commands that get inserted into this command list happens in CPU order. But a single RHI command list can record work into multiple RHI contexts. You have one of these contexts per pipeline that you're targeting, so either graphics or compute. Generally, you have either one or two contexts per command list. And as the commands are inserted, we have these two functions, switchPipeline and enqueue lambdaMultipipe. That is what toggles between, it directs the commands towards whichever appropriate context the commands are for. So say, for example, when RenderGraph is replaying passes and there's a pass for the graphics queue and then a pass for the compute queue, inside RenderGraph there will be a call to switchPipeline from one to the other to direct it over to ASINCompute. All of our RHI command lists are submitted via the immediate command list with those two functions there, the queue async command list submit and immediate flush. And all of our command lists, they operate in two phases. They're either initially recorded and then later what we call translated. And translation is that process of replaying
the recorded commands, calling into the RHI context, and generating the actual GP platform commands.
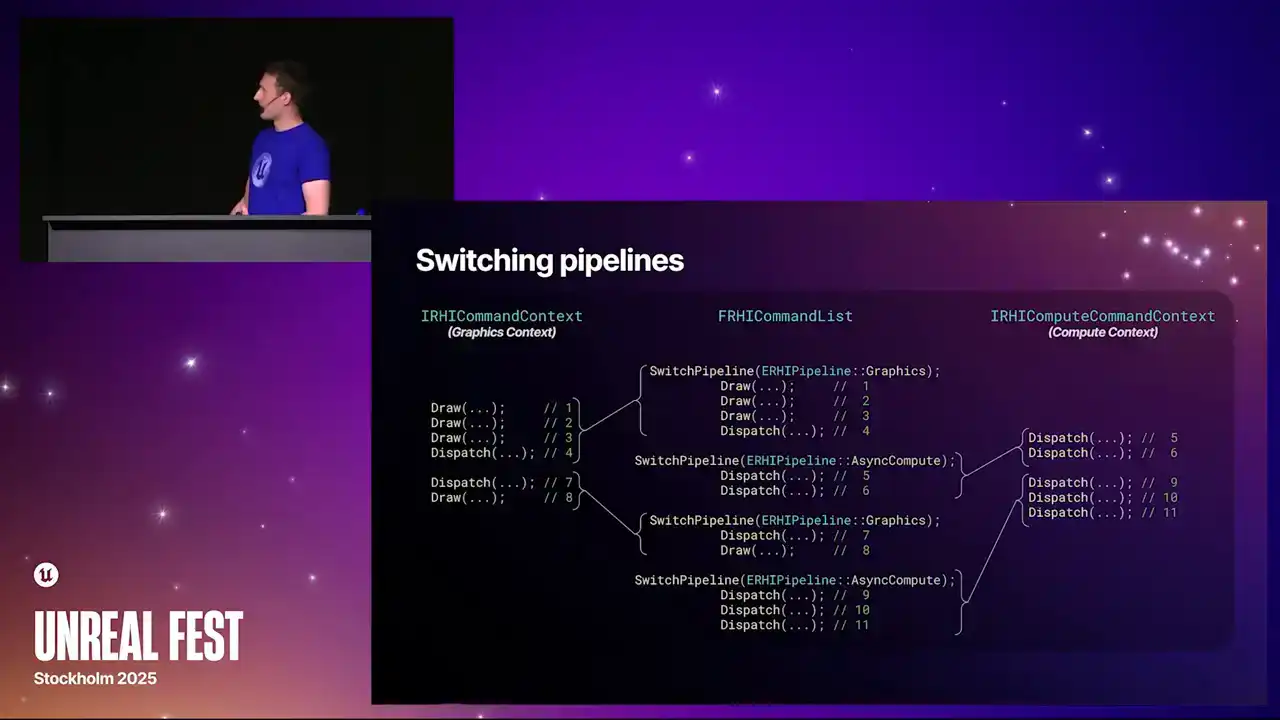
And so this is exactly what the switch pipelines looks like. In the center is an example command list with loads of commands in. And then you get the interleaved switch pipeline calls that just direct when we do the translate, it directs those following commands into the appropriate context. One other thing to note is the context themselves are required lazily. So if you have a command list that only uses graphics, it will only acquire a graphics context and only do the work for the graphics pipe. So it saves you the work of like, if you were
to grab both at the same time, you'd end up with a context that had no work in it, And it's just an overhead. So at this point, I'll apologize. I'm going to switch to just reading directly from my speaker notes, because this slide is really complicated. And yeah, there's a lot of information here that I need to make sure that I get right.

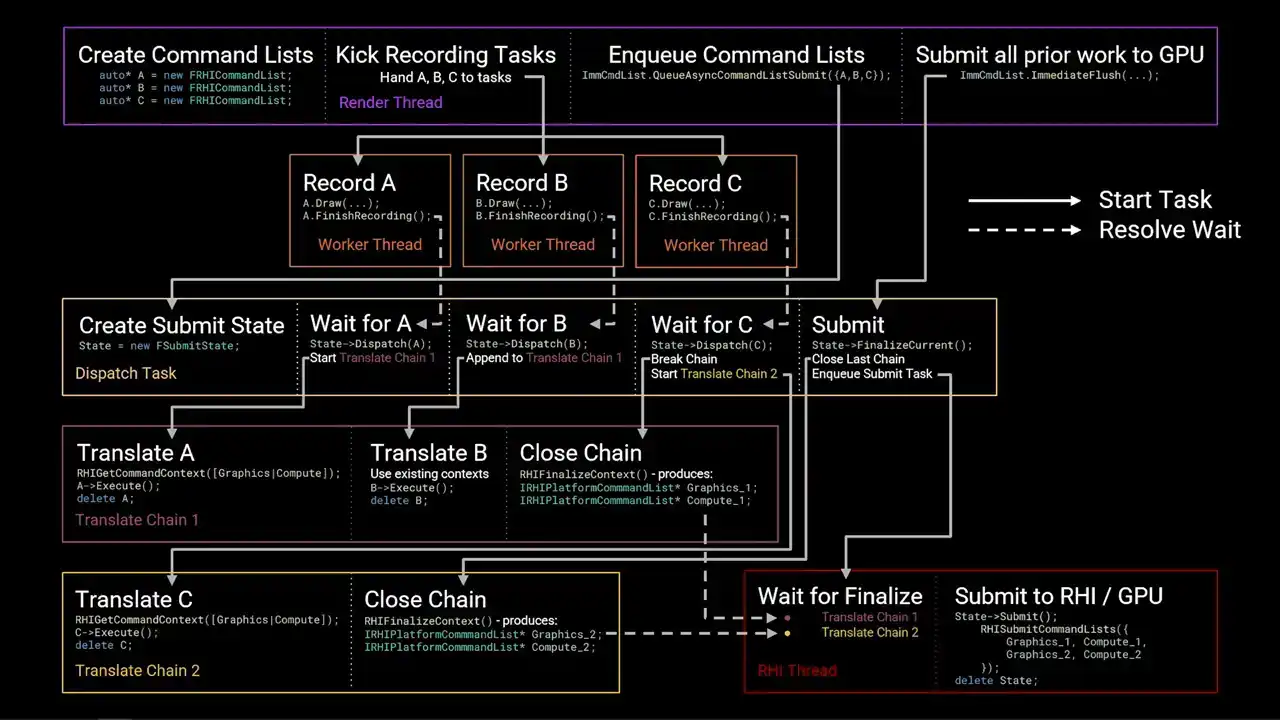
So you'll have to bear with me and read just from my notes. So over the next few slides, I'll walk through an example of how RHI command lists are created, recorded, dispatched, translated, and submitted to the GPU. This is a multi-step process with lots of tasks and parallelism. You don't need to take all of the information in on this slide immediately, as I'll be stepping through the stages
and adding arrows to the slide to show task flow. Solid arrows indicate where one task starts another, and dashed arrows indicate where a wait is resolved. The colored boxes represent threads or chains of tasks. They execute left to right on the slide.
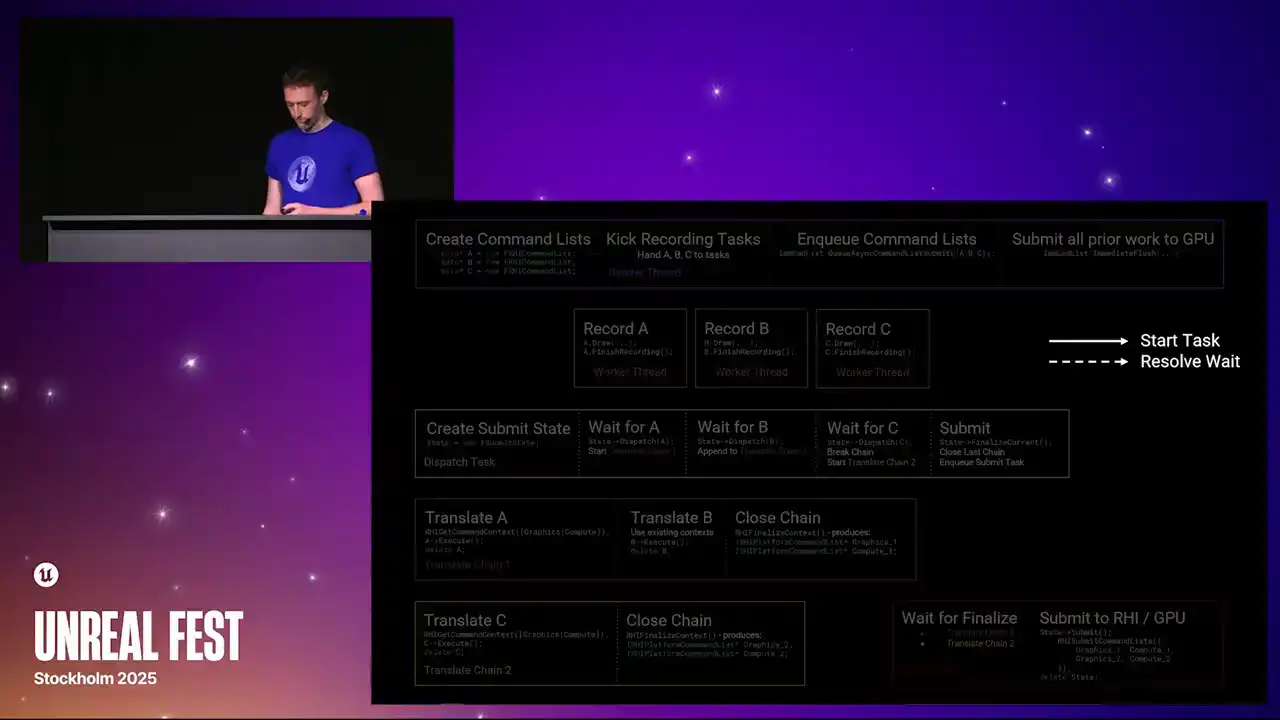
None of the steps block unless the step is explicitly marked as a wait. To begin, the render thread creates three new RHI command lists, which we'll label A, B, and C. It then kicks a set of tasks to record work into these command lists. Each recording task runs concurrently. The main source of these tasks in the renderer today are from RenderGraph Parallel Pass Execution. When the command lists have been fully recorded, the recording tasks will call Finish Recording. This function signals that the command list is completed and ready for dispatch. Meanwhile, the render thread has continued on and has called QAsync Command List Submit, passing the three command lists. The order of A, B, C is significant, as this is the submission order, and therefore the order that the work will be sent to the GPU. QAsync command list submit will launch a new task called the dispatch task. This task is responsible for grouping command lists together into translate chains to achieve parallelism. It starts by creating a state structure to track the progress of the submission. After creating the state structure, the dispatch task awaits completion of the first command list in submission order. This wait is resolved once the recording task is called finished recording. At this point, command list A is ready for dispatch. Since this is the first command list in the submission, the dispatch thread starts a new translate chain. This is another task graph task which is responsible for replaying the commands recorded in the RHI command lists into RHI contexts. Translation is the process that calls into the platform RHI implementation to generate actual GPU-specific command lists. The translate chain acquires the relevant RHI context by calling rhi get command context and then executes the command lists. The contexts acquired are stored on the chain for later use. Command list A is deleted once execution has completed. While translation of command list A is in flight, the record task for B has finished. The dispatch task has been waiting for B to be completed, and once it has, dispatch is B. Since A and B were relatively short command lists, the dispatch task decided to append B to the first translation chain. The context for the translation chain, excuse me, the context the translation chain acquired while translating A are reused for B. Again, B is executed and then deleted. As before, the dispatch task has moved forward and is now waiting for C to be completed. However, this time, the dispatch task decides that it should avoid appending C to the first chain to achieve better parallelism. Instead, it issues a close command to chain 1. This causes chain 1 to finalize the context it had acquired once all translations in that chain have completed. Finalizing an RHI context converts it into an IRHI platform command list pointer, which contains all the platform-specific GPU work generated by that context ready for submission. These pointers are stored on the chain for later. Meanwhile, the second chain is started by a dispatch task. As before, contexts are required, C is executed, and then deleted. While all of this has been happening, the render thread has continued on and called immediate flush on the immediate command list. This function flushes all prior work and will eventually result in submission of work to the GPU. It achieves this by appending a submit command to the end of the dispatch task to run after all prior command list dispatches have completed. The submit command closes the last open translate chain. This is the same as before. The acquired contexts are finalized into platform command list pointers. The submit command also enqueues the task for the RHI thread. The RHI thread waits for the translate chains to be closed, then retrieves the finalized platform command lists. It then forwards these command lists to the platform RHI implementation via RHI submit command lists. Again, the order is important. Work from chain one is submitted before work from chain two. Finally, the tracking state structure is deleted. So there we are. That's the full graph. That's quite a lot. As I mentioned, this is the full run through of everything that happens from the render thread
all the way down to the RHI thread.
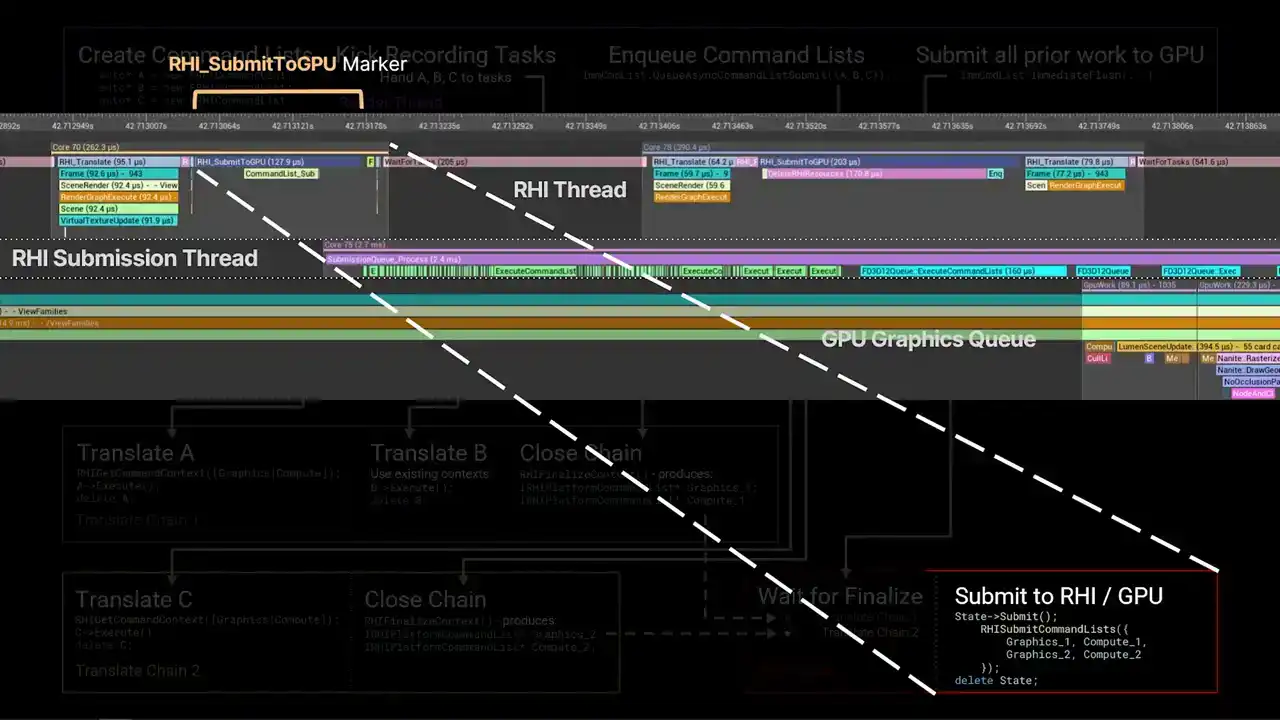
An interesting thing to note is that this final box in the lower right, that was the marker that I was referring to when we were talking about Unreal Insights earlier, the RHI submit to GP marker that occurs on the RHI thread. So that whole flow graph goes up to that point. And then after that point, the platform command lists get pushed into the platform RHI. And then from that point, the submission thread
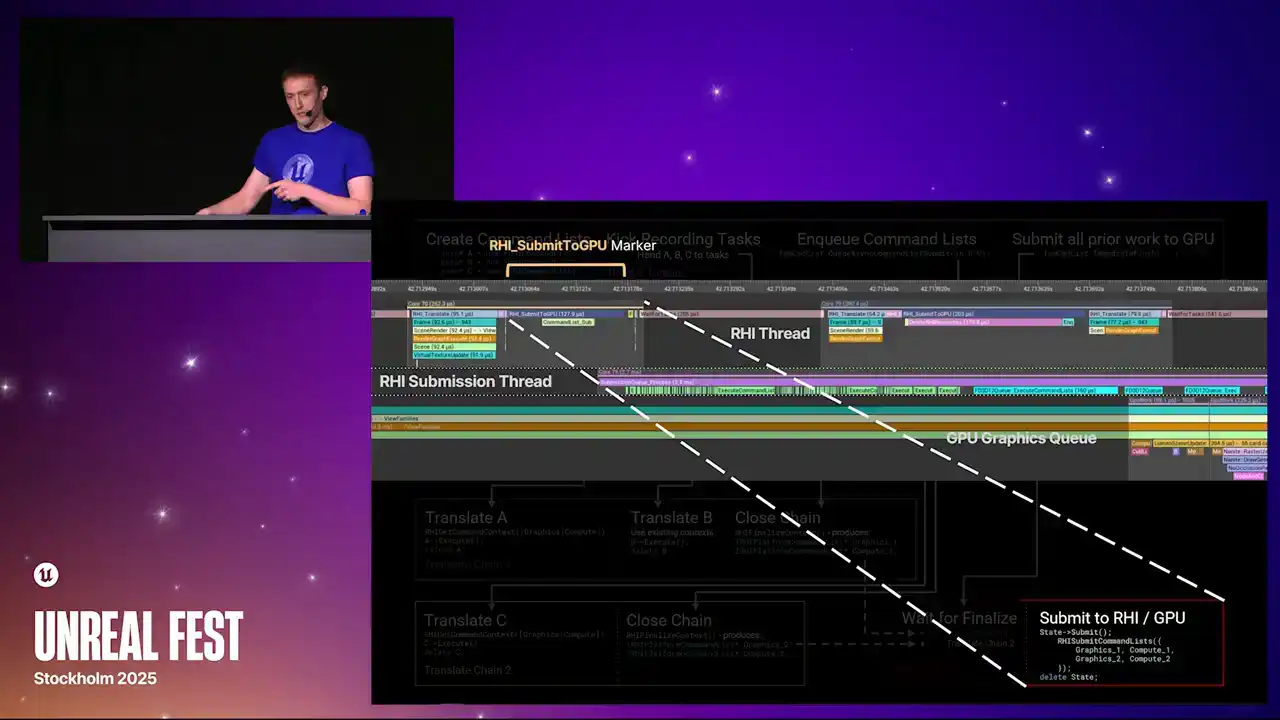
of the GPU is kind of an implementation detail of the particular platform that you're running on.
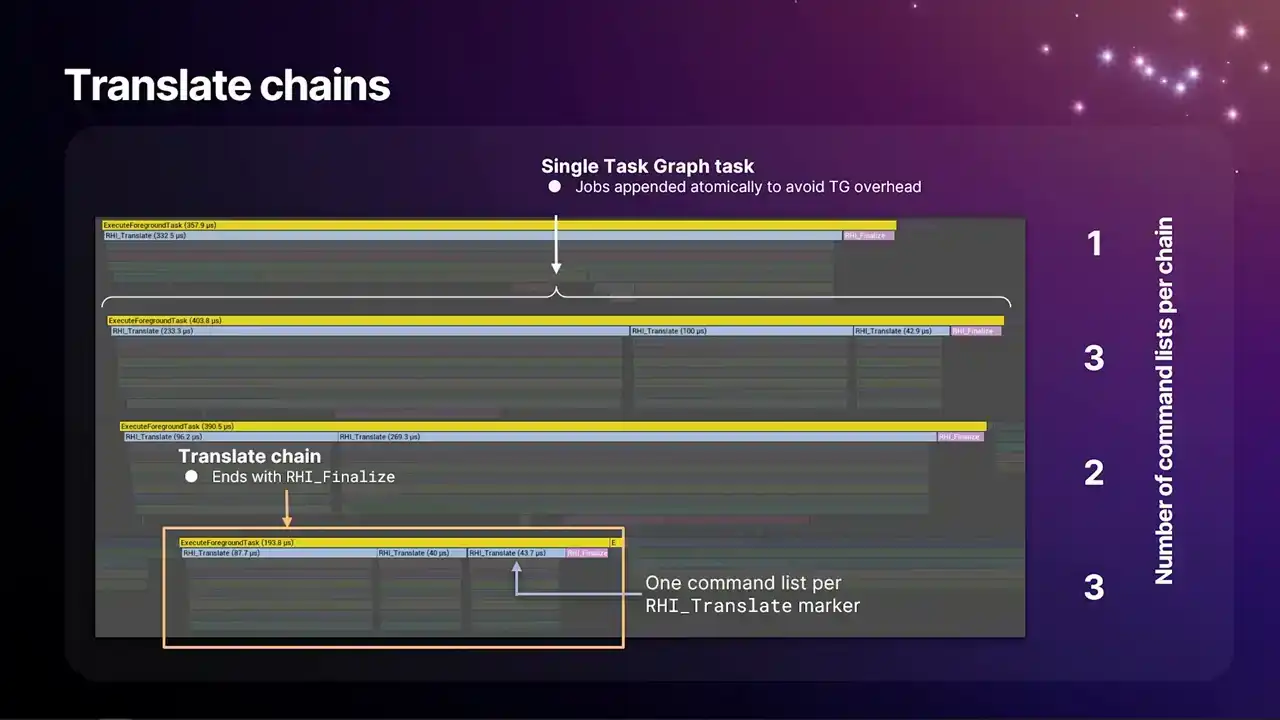
So this is what the translate chains look like if you were to take an insights capture. Each one of these lines here is a single translate chain. And each of the blue markers within those lines is a single RHI command list that's being translated. We have this RHI underscore translate marker above each of them. And each of the chains end with an RHI finalized command, which is the pink marker at the end of each line. And one thing that we do here is that to avoid some task graph overhead, as we build these chains,
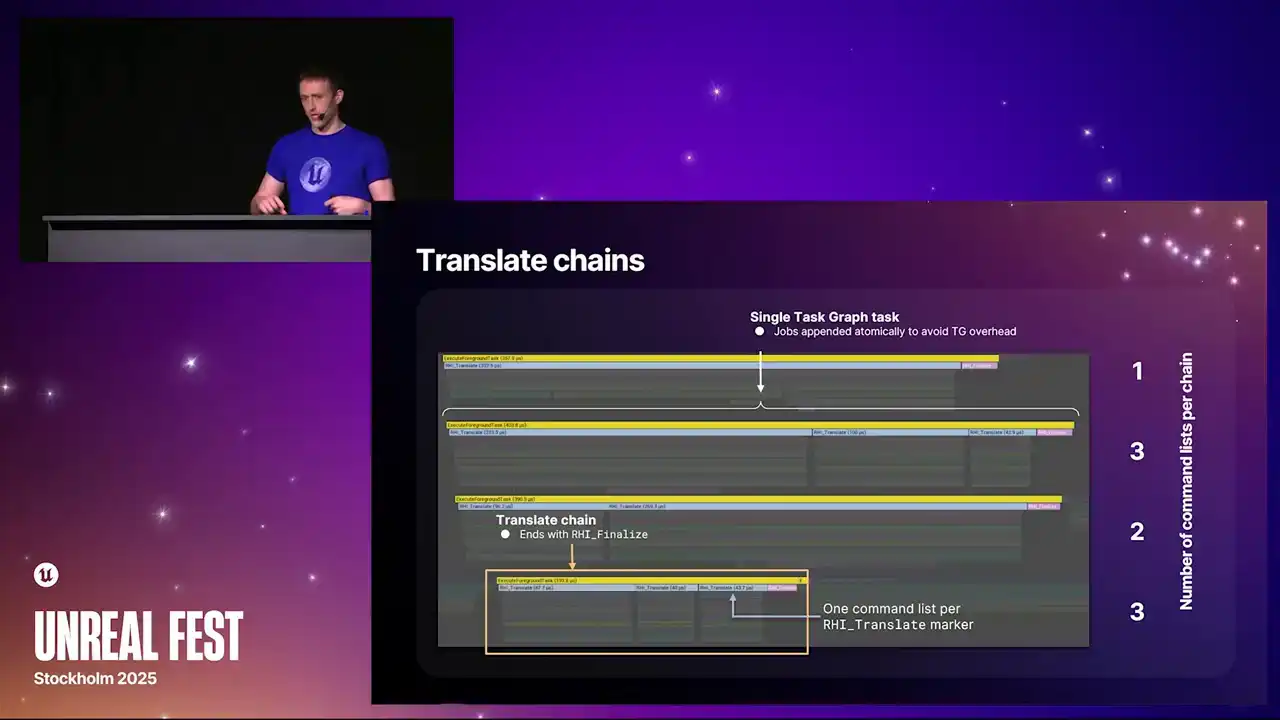
we append command lists to the end of the existing chain atomically in a way that the task, if the command list has arrived before the task is finished, it sees that there's another command list to continue and it just pops it and just loops back again and runs it again,
which minimizes the overhead We used to have a version of this where there was gaps between each because every single command list was a task graph task and the overhead was too much But crucially the question then becomes when exactly do we break the chain

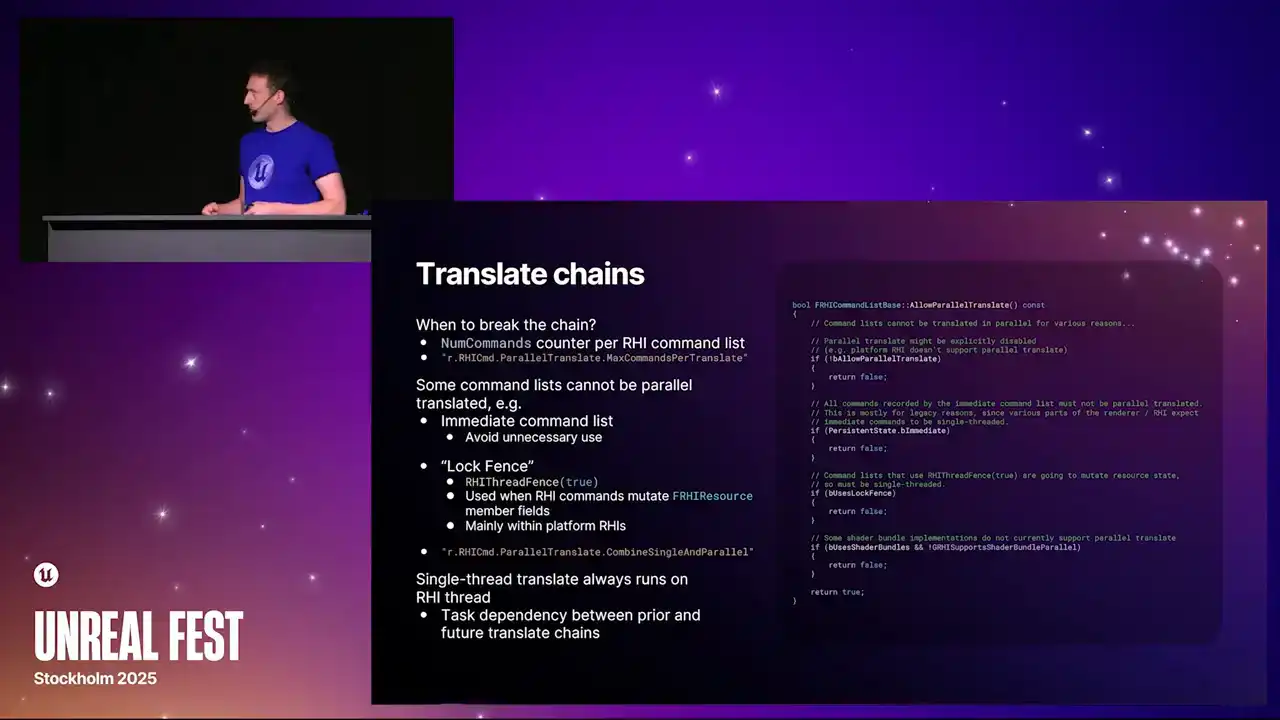
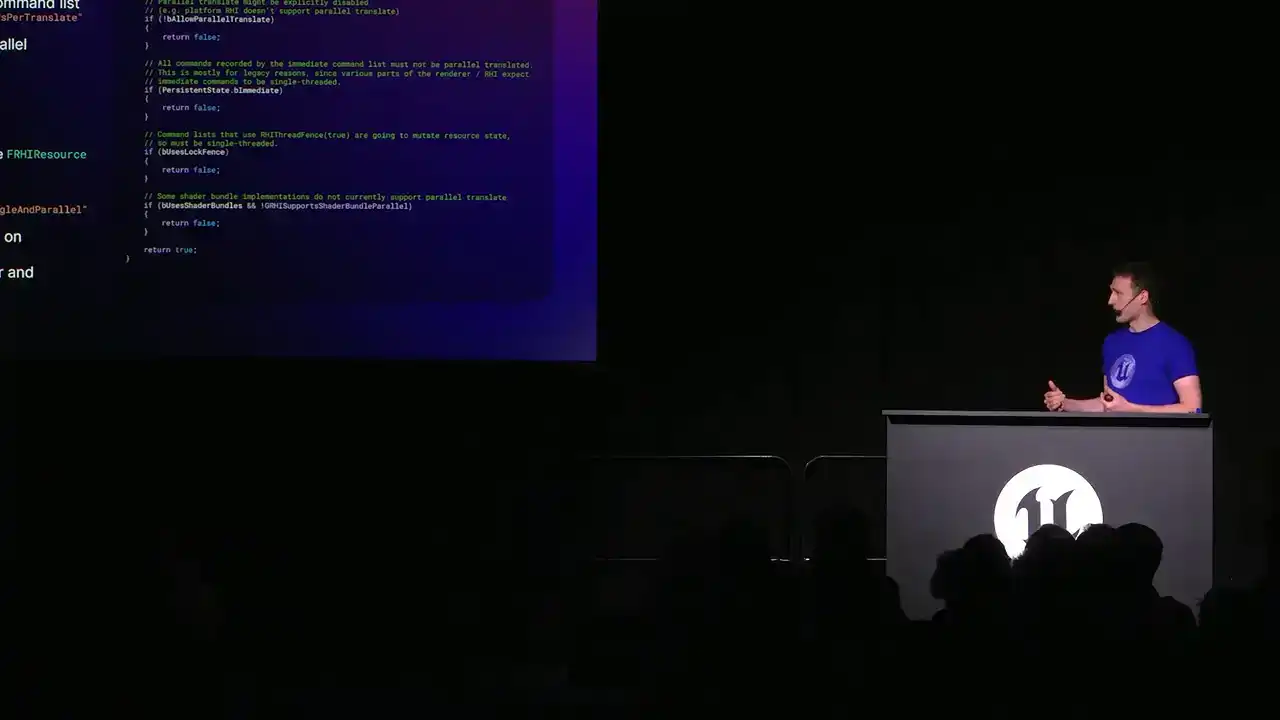
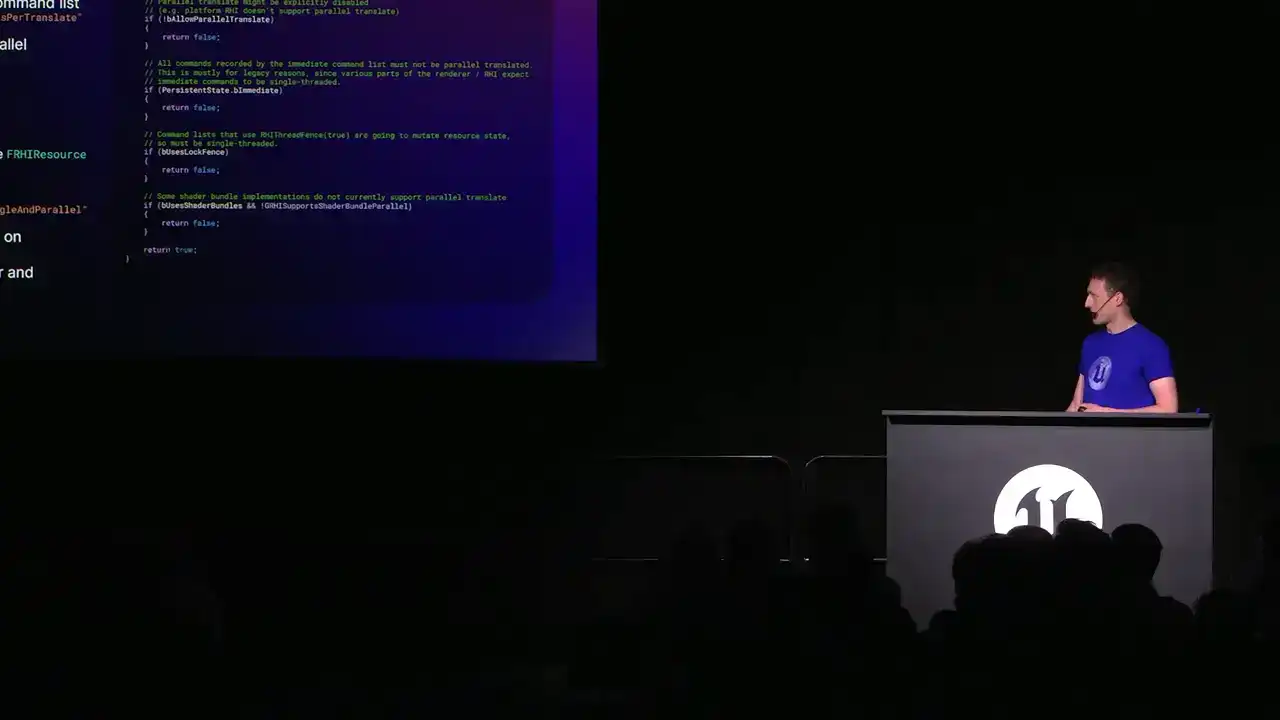
When do we, how do we decide how wide we're going? How many of these chains we're producing? The short answer is we count the number of commands on the RHI command list. We have a num commands field per RHI command list. Every time you call a function on an RHI command list that results in an allocated command that just increments that counter. And then by the time the RHI command list arrives at the dispatch thread or the dispatch tasks, we know how many commands are coming up. We know, so we know kind of roughly how big the command list is. And then we have the CVAR, r.rhiCommand.parallertranslate.maxCommandsPerTranslate. And it's just a high watermark. You set that value to like a thousand or something, then we'll build chains up until the next command list will reach that limit, and then we'll start a new chain. but besides that mechanism there's also a handful of reasons why we can't do parallel translate on some command lists the full reasoning is the code snippet on there I don't expect you to be able to read that but that's kind of the function you want to look at if you want the reasons
the main one being or one of the big ones is any use of the immediate command list that's the one that's the global singleton the one that's owned by the render thread because that thing's been around since very early UE4 there's a lot of systems that were still using that relied on that weren't thread safe. So it wasn't possible to run that stuff in parallel. So even today, any use of the immediate command list
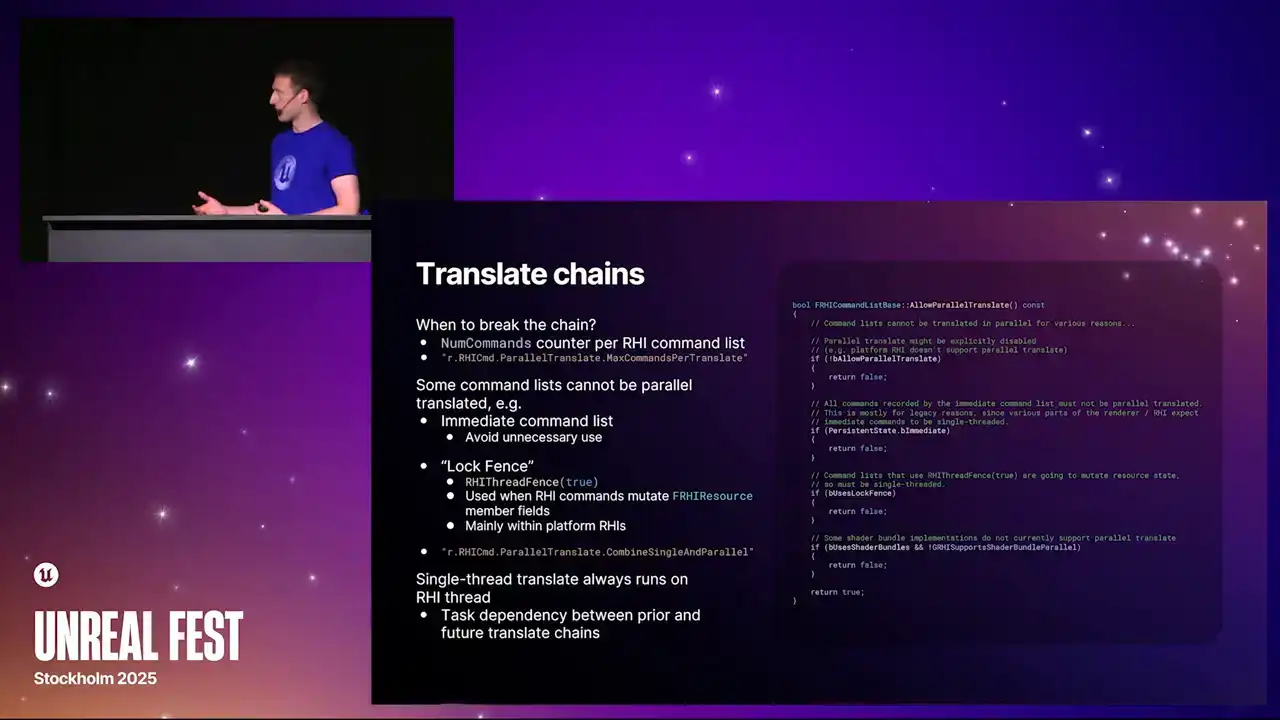
to do drawing work will result in a single thread translate and is a bit of a perp hit. So generally, you should avoid unnecessary use. That means in your render graph passes, the type of the command list that you take,
you can take a base one, just like frhi command list, which will allow parallel translate. But if you take one that is the immediate command list, then you'll be causing this to happen. There's also a mechanism that we call the lock fence.
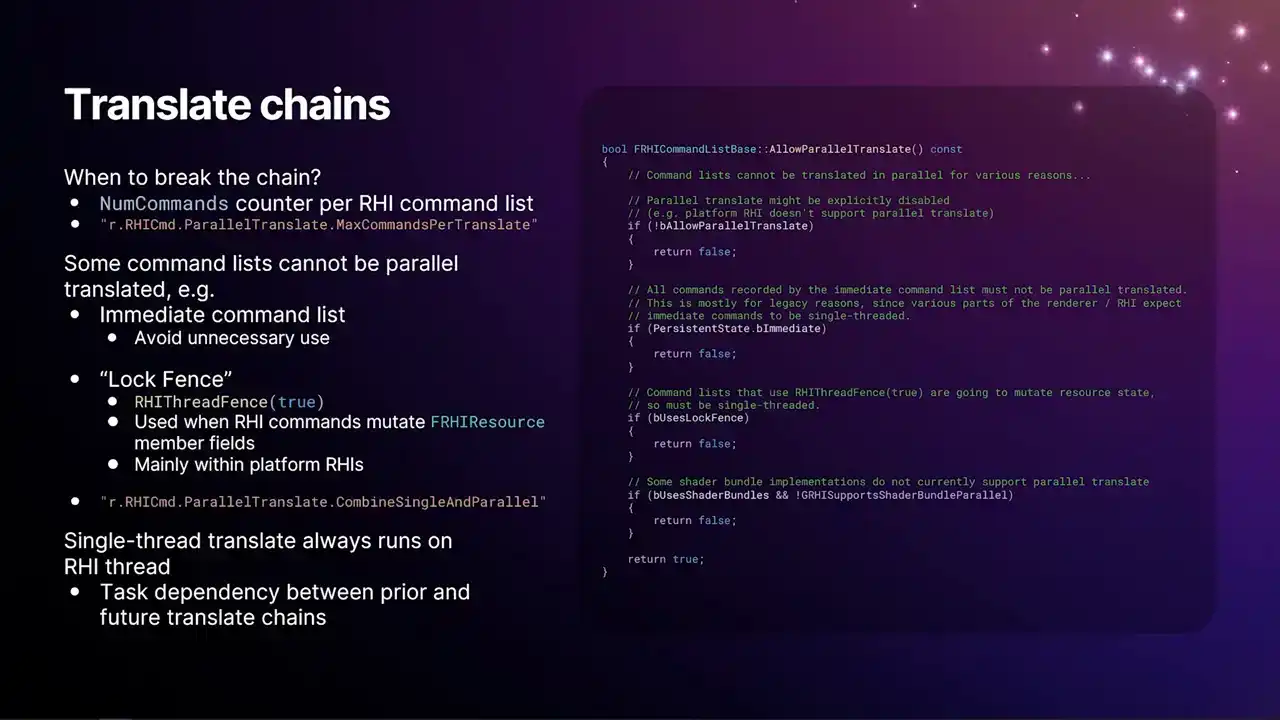
The name came about because this was originally used in RHI buffers for lock and unlock to update buffers on the GPU. But it's used today for any time there's an RHI command that will mutate to the CPU side of an RHI resource. The reason that buffers use it is because on most of our platforms, when we lock and unlock a buffer, we're not actually updating the original buffer. We're allocating a brand new buffer in GPU memory to avoid having to stall anything. And then we do a kind of a swap. We call it a rename, which is where there's a pointer to the current buffer in the RHI. And at some point, we swap out that value for the old one, discard, and free the old buffer. But of course, if multiple translates are happening in parallel, we want to ensure that all the commands that happened before the lock see the old value, and all the ones happening after see the new value. So we have to fall back to a single thread translate.
And this is what that RHI thread fence with true as the argument causes to happen. But again, you won't necessarily run into that yourself. It's just an implementation detail of the API.
There are certain APIs that do these mutates that will have this just kind of built in. And then finally, we also have this additional command console variable, r.rhicommand.parallelTranslate.combine single and parallel. And so when this is enabled, it means that any RHI command list that could have been parallel translated will be a candidate to join a translate chain that is forced down to single thread. So if you turn this off, then it means
that any RHI command list that could be parallel translated will be parallel translated. And it won't be kind of siloed into running on just the RHI thread because of some other command list that has to be single thread translated. So that console variable together with the max commands to translate one are your two primary tunables for determining how wide the renderer will go.
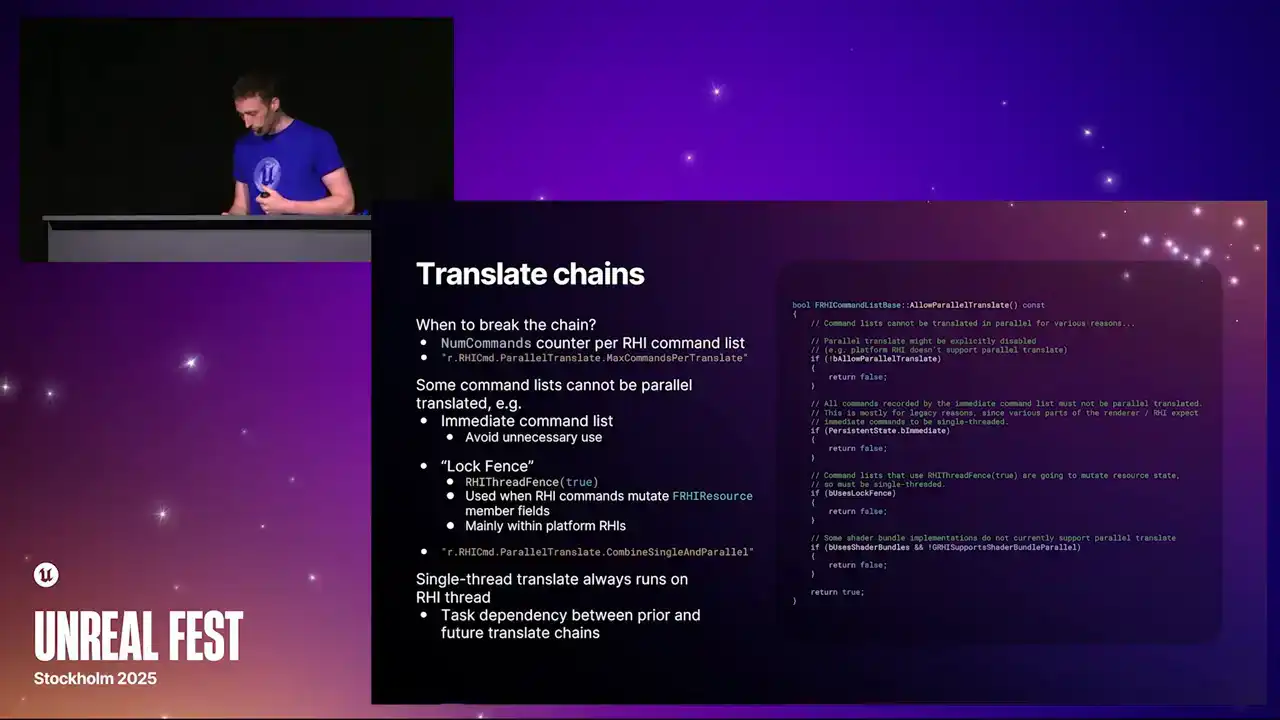
Excuse me. So these are the two kind of things you want to experiment with and run a load of perf captures on. If you're targeting hardware that has fewer cores or more cores, generally you'll want to go wider if you're on a system with multiple cores. It will go narrower if you're on a more limited system. And I think I already mentioned, but the single thread translate always runs on the RHI thread. And this was, again, because of a legacy reasoning. There's certain code that expects to be on the actual physical RHI thread.
And we achieved this with some task dependencies between the tasks.
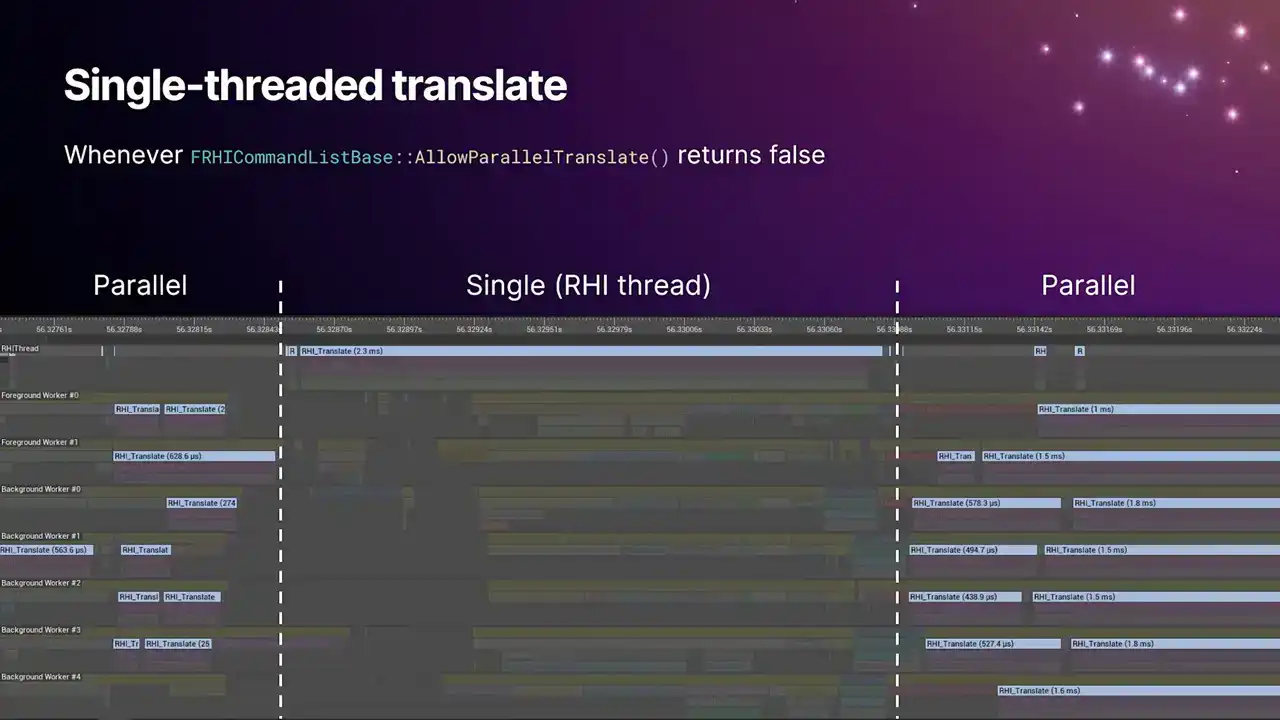
And again, so this is what this looks like in Insights. So you'll get single thread translate any time that allow Paradox Translate function on the command list returns false. And you can see we have two blocks of parallel work, and then we just fall back to single thread for a duration. I think this screenshot's probably about over a year old now. And the reason for this particular single thread translate was some ray tracing APIs that was using the immediate command list. I believe we fixed this now, although don't help me do that. And yeah, so we're slowly moving towards a world where we're trying to reduce the amount of single thread translate that happens, because it's just perfect. It's just a bubble in the pipeline.
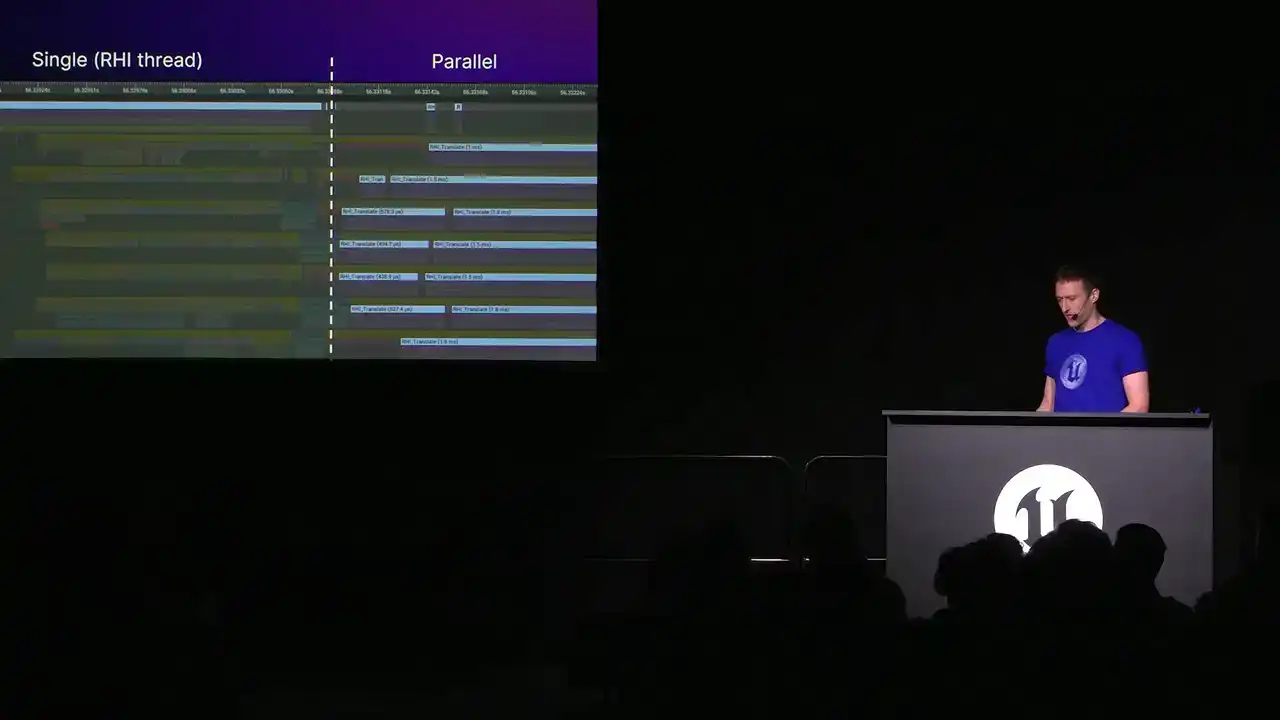
It doesn't scale very well.
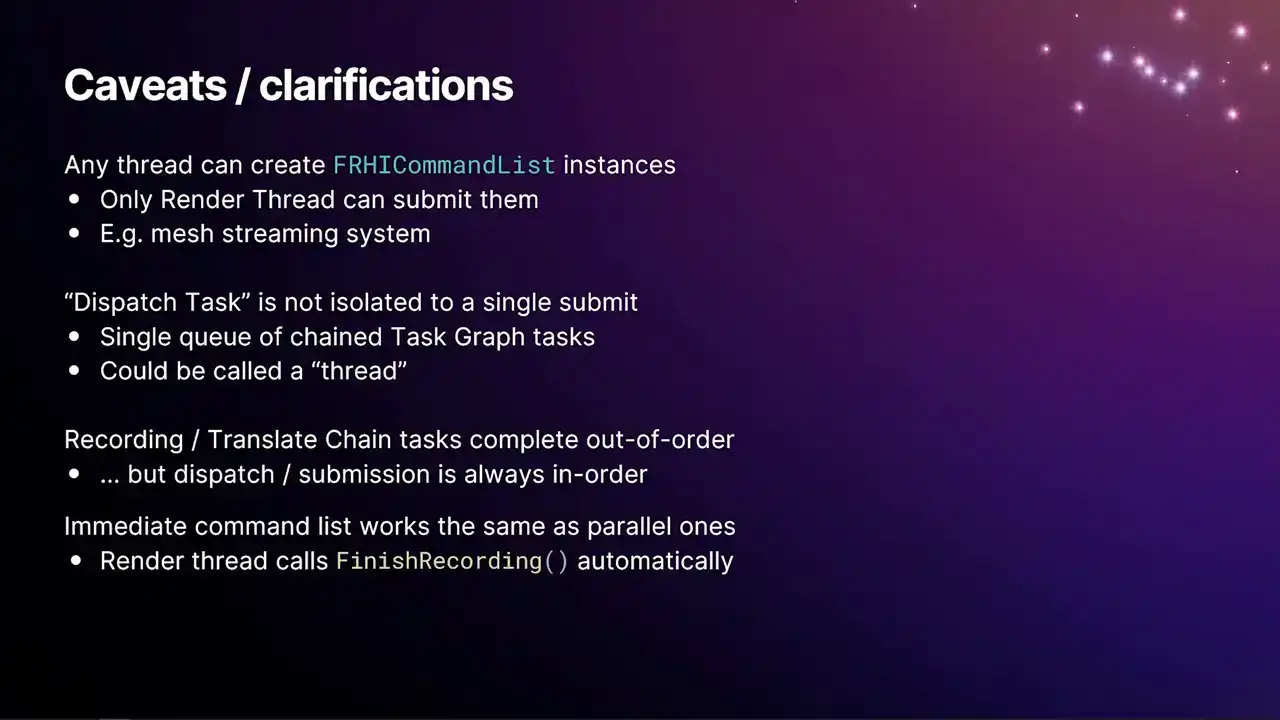
So a few caveats and clarifications about all the stuff I've just said. Any thread can create an RHI command list instance, but only the render thread can submit them. A good example of this would be our Mesh streaming system. In order to stream a mesh, we're pulling vertex and index data off for hard disk. And on PC, getting that into the actual GPU memory involves work on the GPU. The OS, like Windows, will get you as far as bringing the data into system memory, into an upload heap. But then the GPU actually has to copy that data into its local memory. So as a result, if you want to create a buffer in the RHI, you need a command list. The function to create a buffer is on the command list type And so what happens in the MeshStreamer is the MeshStreamer thread that running in the background creates its own RHI command list It uses it to create the buffers and fill them in with the initial data And then the very last step of the MeshStreaming system, when the buffer gets handed over to the renderer,
is a task on the render thread gets enqueued. And then the command list that it created gets handed along with that and then submitted through the immediate command list. And from that point onwards, the buffers are now safe to use. So there's kind of like a handover mechanism that happens.
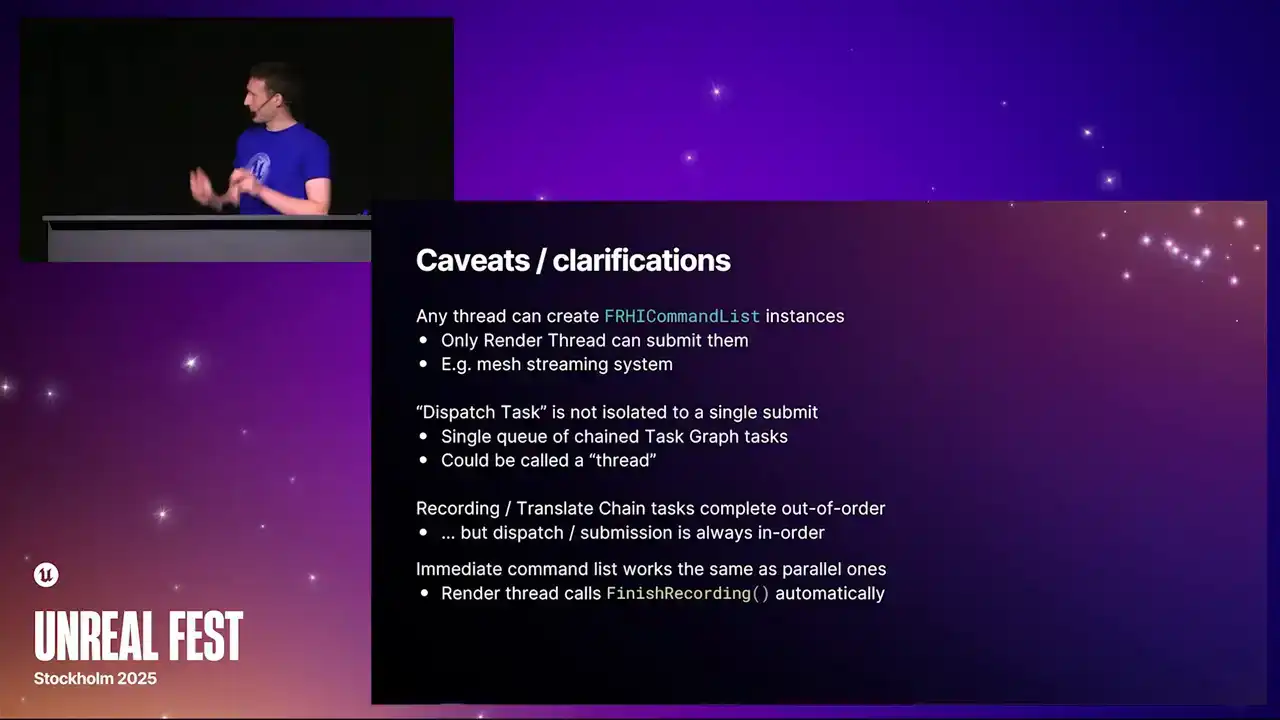
The dispatch task, so in quotes, is not isolated to a single submit. You could think of this as a thread, really. We don't call it a thread because it isn't a physical thread, but it is a continual chain of dependent tasks. I know in the flow graph example I gave earlier, it looks like the dispatch task is only relevant for that particular submit. But actually, there's dependencies off either end of that.
It's just a chain of tasks. So yeah, a dispatch for a subsequent job won't run until the previous ones have completed in submission order. But generally, the dispatch tasks are so short, you don't see them being a bottleneck. The recording and the translate chain tasks
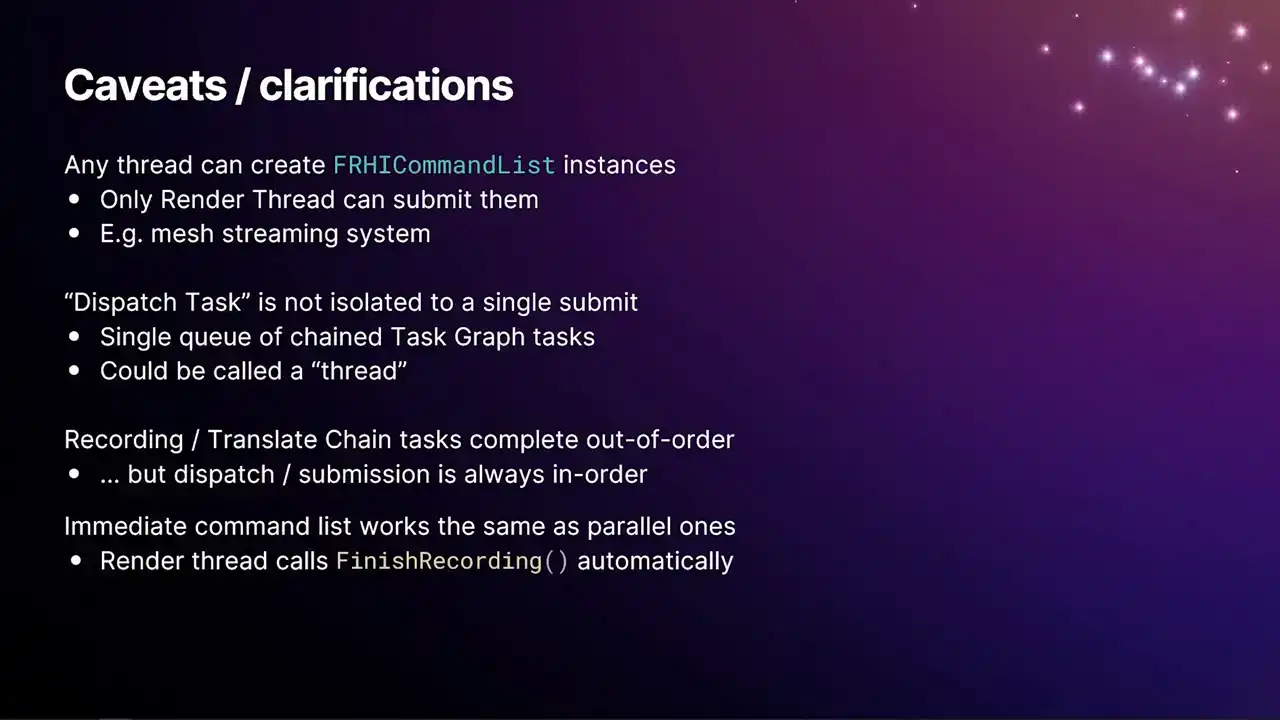
complete out of order, but the dispatch and submission is always in order. Again, this goes back to that, the reason why we have the lock fence and so on is because those translate jobs, they're just kind of free to run on the task graph and they complete out of order. But all of this management logic then has to kind of reorder everything back into the correct order to hit the actual GPQ. And then finally, the immediate command list works exactly the same as the parallel ones. You can do drawing on it. You can do all the same stuff that you can with the parallel command list. I'd advise you don't, because we should be avoiding the immediate command list. But the only difference is that you
don't call finish recording. Finish recording was a mechanism to get this kind of parallel stuff to work, and it doesn't need to happen on the immediate command list. I think it'll actually crash if you do. There's an assert in there, I think. OK.
So that covers all of our submission pipeline stuff. But we'll now just kind of go into our RHI breadcrumb system.
And the RHI breadcrumb system forms the kind of underpinnings of everything that we've done in the new GP profiler. And it was kind of, it came about as there
were multiple systems in the engine and in the renderer that were trying to label renderer work so that you can see what you're working on in like a PixCapture or anything like that. And all the systems are competing with each other. They weren't correct in all the threading scenarios. And there's multiple ways that the engine runs threads across all the different platforms. So we needed a system that brought everything together. And the Archive Broke-Rub system is what came out of that. So this is what they look like in Insights. You probably can't read that on the slide,

but the area that's highlighted with the brackets, everything from the frame marker down is a breadcrumb. And the breadcrumbs, we tag certain areas of the renderer with certain names. And then that breadcrumb, that same breadcrumb, appears everywhere that it can. So you'll see them on the render thread. You'll see them on parallel pass RDG execution. You'll see them on the parallel translate. You'll see them on the RHI thread. You'll also see them on the GPU. It's all the same marker all the way through.
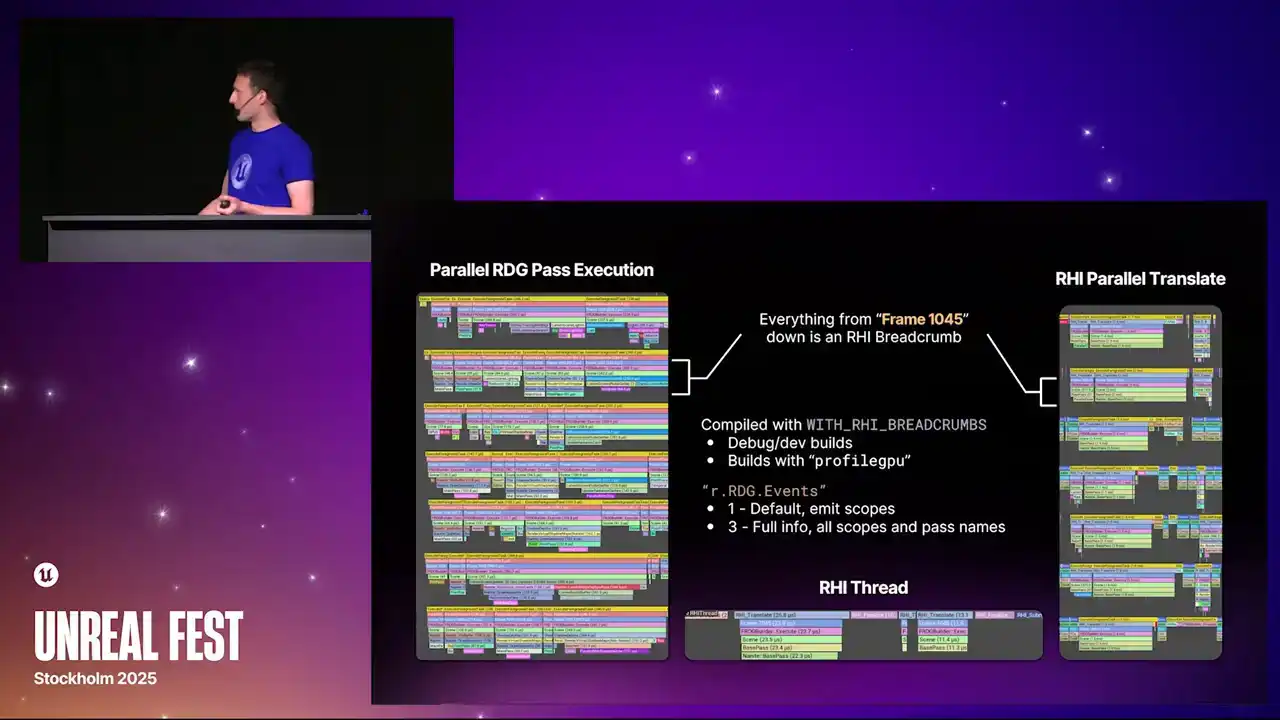
And this gives us some real good context as to what a thread is working on. Previously, you just saw, oh, it's doing render graph stuff. But you actually had no idea what pass it was working on. If something's really expensive, you have to profile with sampling or something. So these are in every build that has that macro enabled
with RHI breadcrumbs, which in vanilla UE is every debug and dev config build, but also built with the profileGPU command enabled. There's some additional macros that can turn that on in test or shipping.
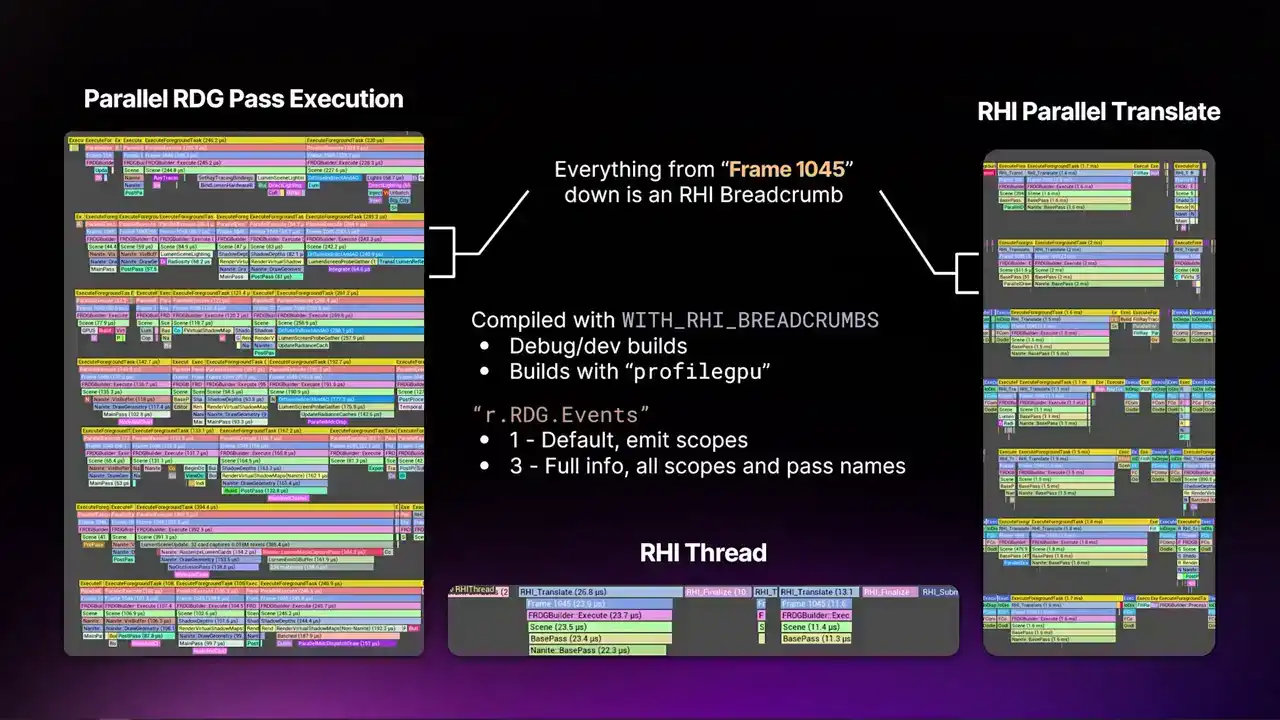
And when you do that, you'll also get the breadcrumb system as part of that, because the profileGPU relies on the breadcrumb system to work. And then we also have this console variable, r.rdg.events. This determines how much detail render graph will
emit to the breadcrumb system. Obviously, emitting all of the detail all the time is more expensive than not. So the default value here will only emit the high level scopes, things like scene, base pass,
post-processing, that kind of thing. But you can turn this all the way up to number three. And when you get to level three, you get all of the scopes, all the info, all of the pass names, including all their parameters and everything. And that's actually implicitly what
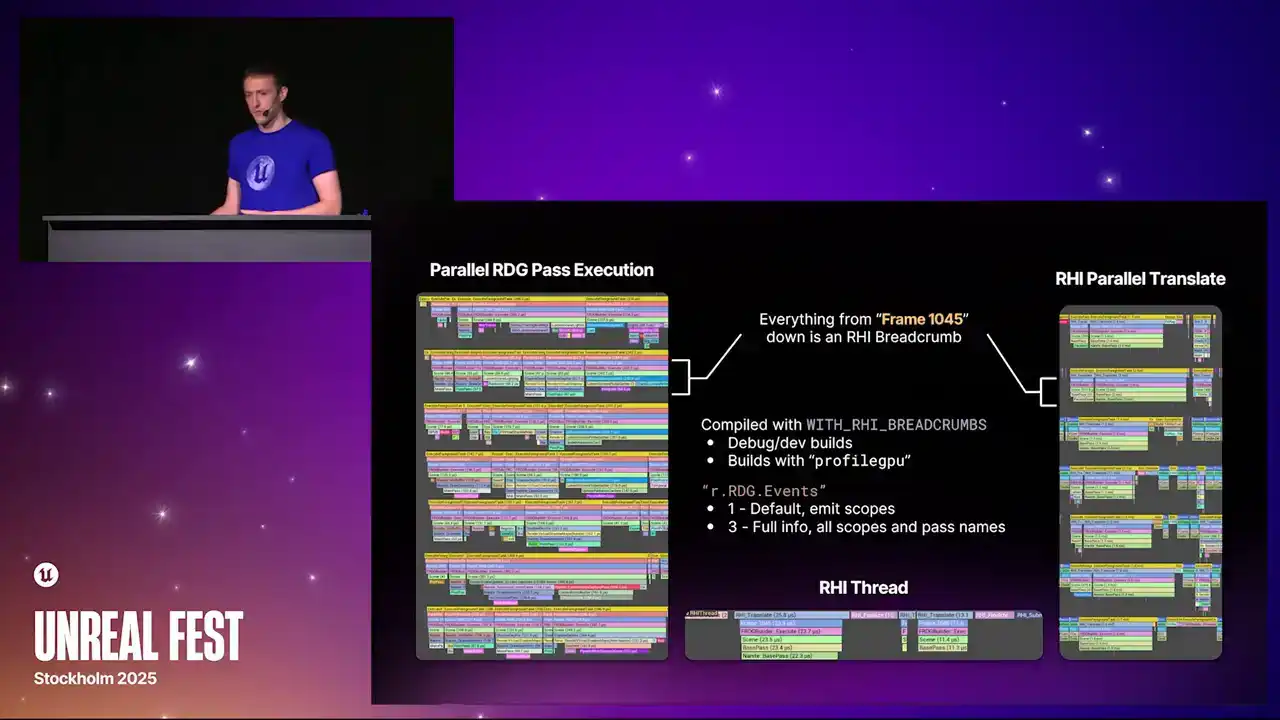
happens when you do a profile GPU is it internally turns out Cvar to three, and you get everything in a profile GPU capture.
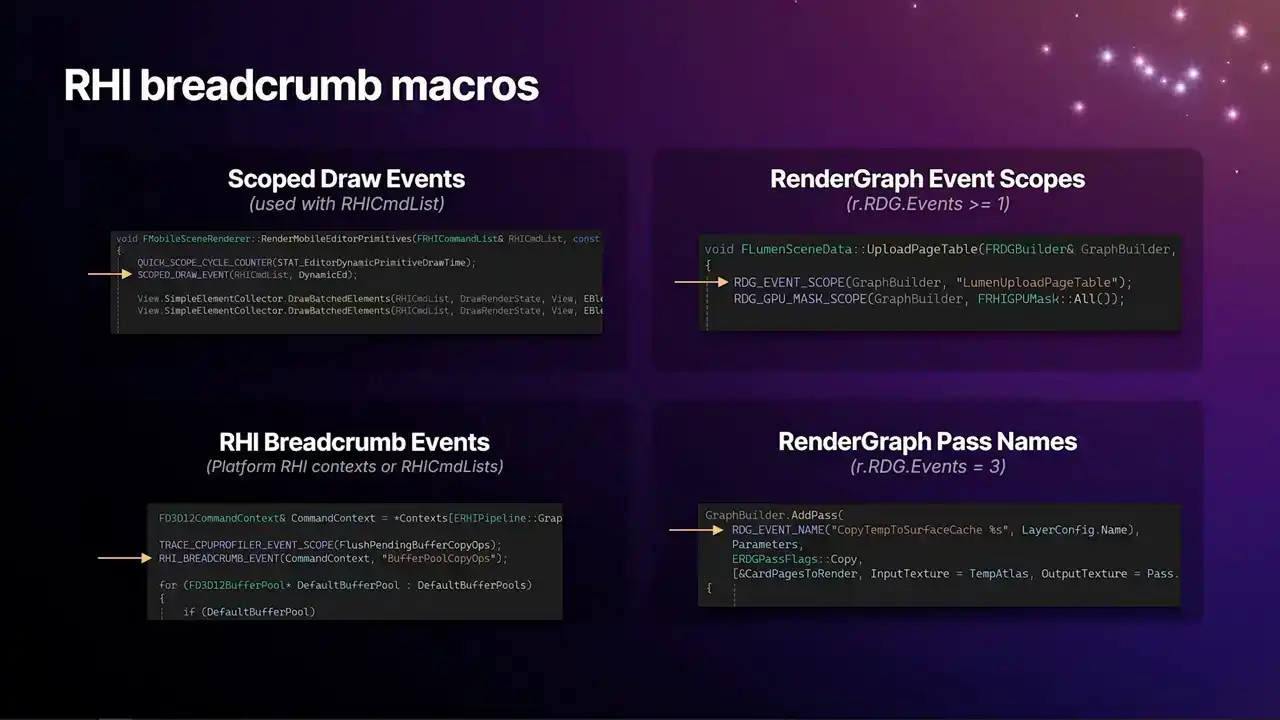
And so this is what they actually look like in code. And like I said, because this was kind of a drawing together of multiple systems that work differently, there's multiple scope macros here that all feed into the same system now. So the implementation of these macros all feed to the same place now. So around the renderer, you'll see the scope drawer events that I've been there for a long time. And in the lower left is the new Breadcrumb macro that this all feeds into. And that macro is capable of taking either an RHI command list or an RHI context. So you'll actually see some of these inside platform RHI's now. The example on the slide there is D3D12's defrag pass that happens at the beginning of the frame. We can now label stuff that is specific to the platform RHI in the same Breadcrumb system, and then you'll get the markers everywhere. You'll get them in Insights, you'll get them in PICs, and so on. And then the ones on the right, render graph, the one at the top, the event scopes are the ones that you get by default, with the events greater than or equal to 1. And then the lower one, the pass names,
are the ones that you'll see when you turn the full system on.
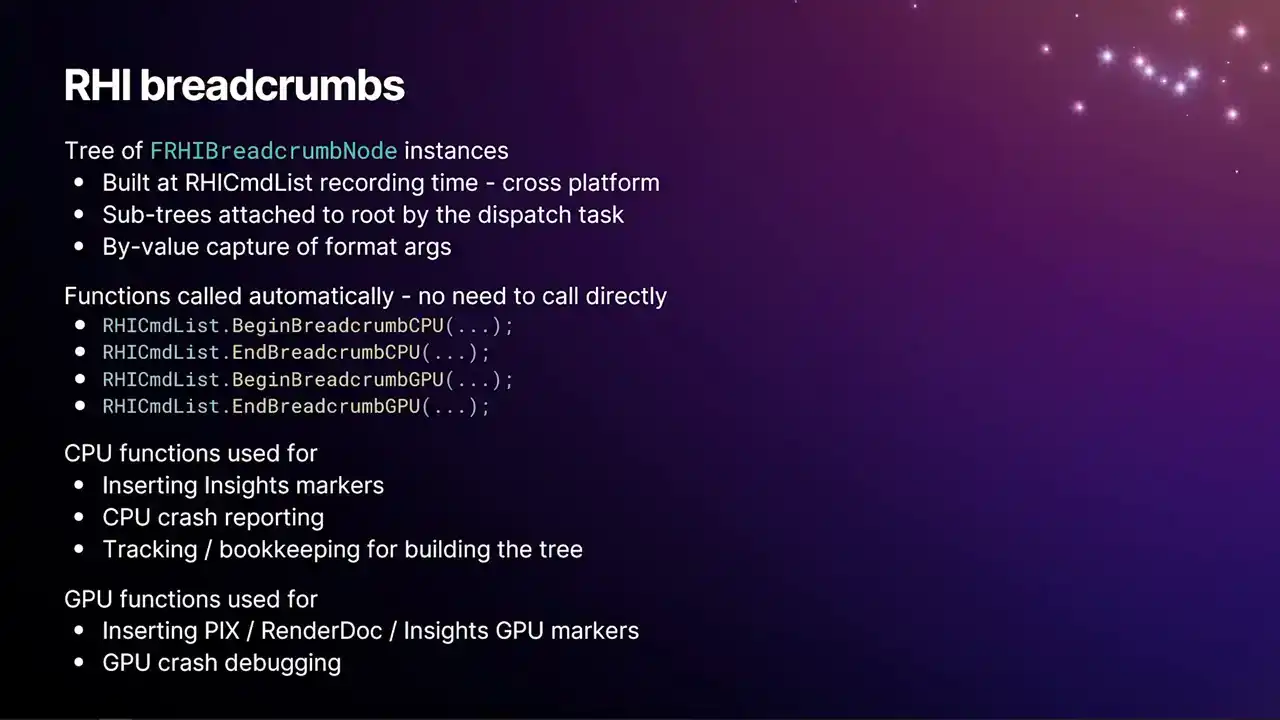
So this is a kind of quick overview of how the breadcrumb system works, the operation of it. As we're recording RHI command lists, we build a tree of RHI breadcrumb nodes that refer to the actual breadcrumb names themselves. And all of that code is cross-platform, so it works on all of our platforms. And since RHI command lists they can be recorded like with the Mesh streamer they can be recorded on entirely separate threads that are separate from the render thread Each RHI command list itself builds a subtree of nodes as it walks in and out of the scopes. And then at the dispatch time, when the dispatch thread acquires that command list for submission, it gets attached to the root tree, which then means that those subtrees appear in the overall overarching tree for the whole frame, and we get the full context all the way up to the frame marker. And we also do by-value capture of the format args. So the primary reason for this is that we want to be able to capture all of the context. Like there's a marker at the beginning of the frame,
which is frame n, where n is an integer. And rather than just calling it frame and not having that extra context, we capture the four bytes for the integer and the pointer to the format string. And then it means that we only have to do the formatting when we need the actual name,
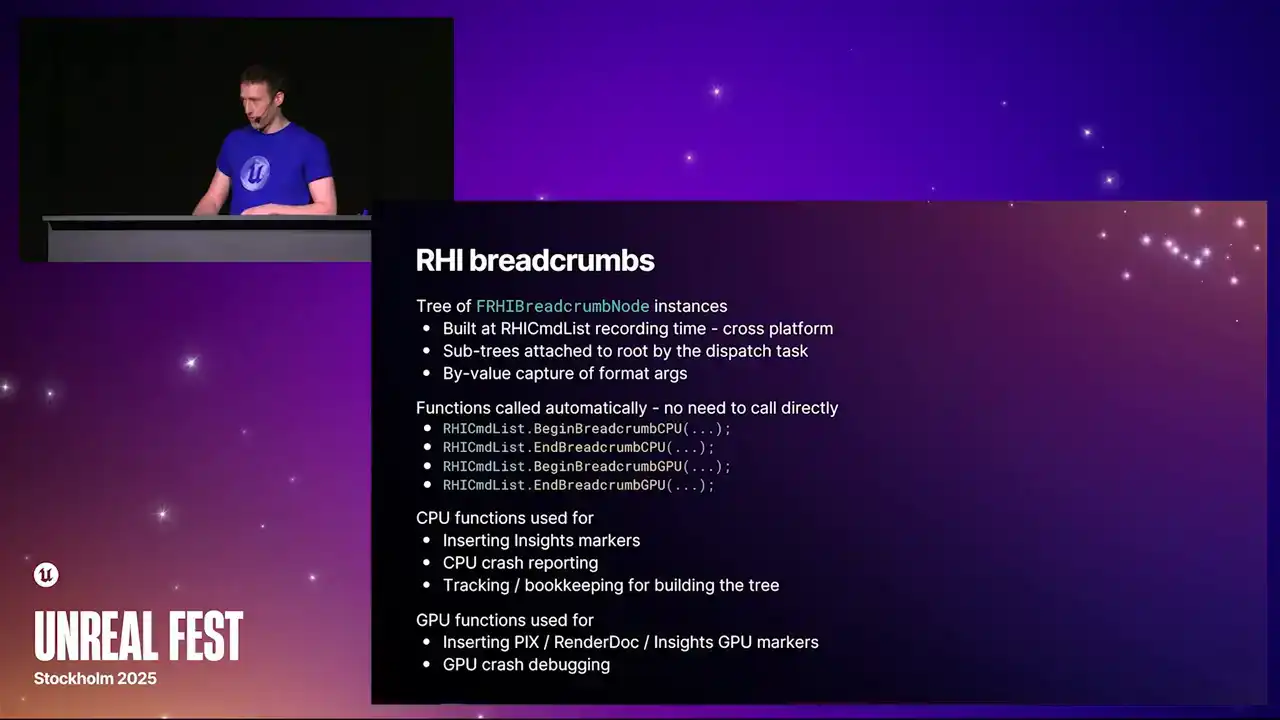
which for the most part, if you're not actually running Insights, if you're not running like a snapshot of that frame of profile GPU, we don't do the string formatting. so it's a lot cheaper. So there's a handful of functions on the Archive Command List, which you don't need to call directly, but I'll just mention them here for completion's sake. So begin and end breadcrumb CPU and begin and end breadcrumb GPU. The CPU functions are used for inserting the Insights markers. This is how we get them into Insights. It's also used for CPU crash reporting. This is something really cool now, is that if you crash, like in previous versions of the engine, if you crash on a thread that is inside a render graph pass, just a parallel pass, generally the call stack
doesn't give you much information. Because the call stack just takes you back to some execute task that came from the task graph. You have no idea what pass it was or anything like that. It's particularly a problem for Compute Shader Passes. Because Compute Shader Passes, there's like a general add Compute Shader Pass function, and you get no context from the call stack. So now when we crash, we can dump into the crash report, the stack of breadcrumbs from the thread that crashed, which gives you all that extra information. Likewise for the parallel translator, if you crash inside the RHI, you know where in the frame you came from.
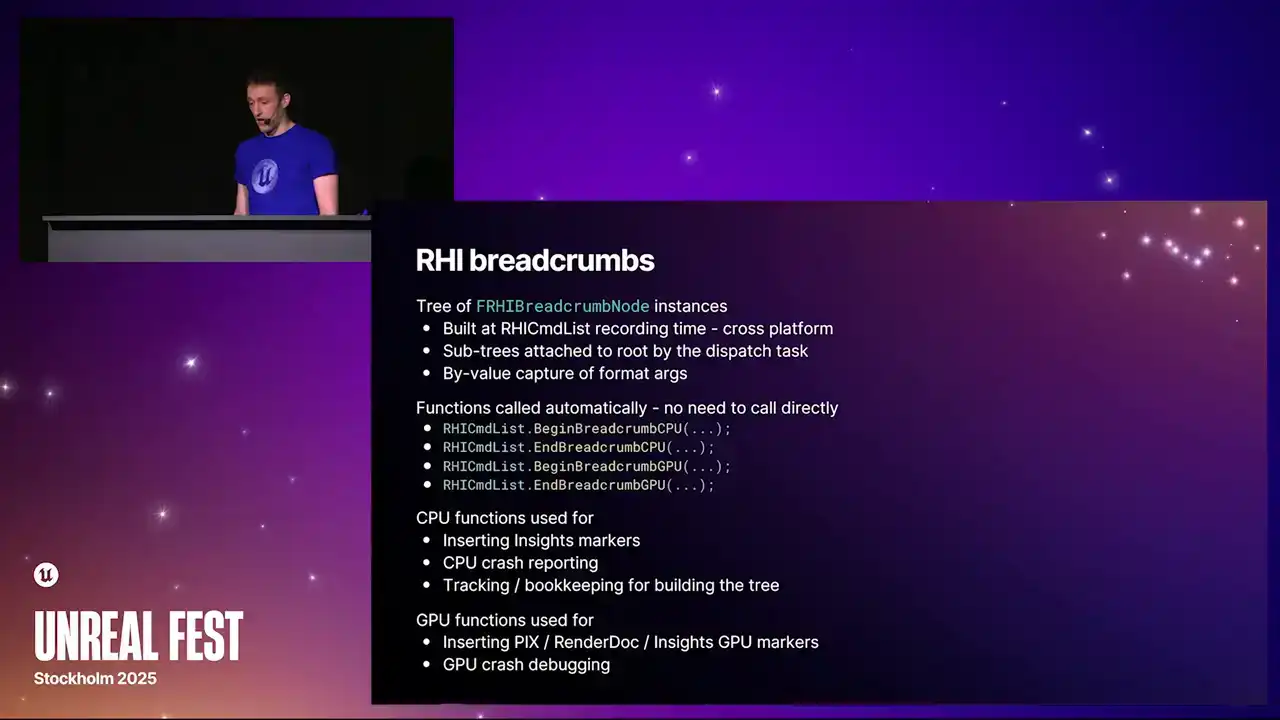
And the CPU functions are the ones that build the tree. They're the ones that kind of do all the bookkeeping and everything. It's quite complicated because we have lots of different threading modes in the engine, so it might be quite hard to wrap your head around. It certainly took a while to write. But that's where all the bookkeeping is. And then the GPU functions are the ones that actually

go and insert pix markers, render.markers, and the insights GPU markers that we see now. And we also have a new system as a result of this for GPU crash debugging.

And so this is what our new GPU crash debugging system looks like. You can turn this on with any of those options at the top there, dash GPU crash debugging, dash GPU breadcrumbs on the command line, or their equivalent CVARs, which do the same thing, r.gp crash debugging 1, r.gpcraftabugging.breadcrumbs one. The first one there is a larger feature thing that turns on a lot of systems, whereas the lower one is just specifically turning on the system that you see on the slide. And the way this works, as we encounter breadcrumbs, as we're replaying them into RHI context to produce the GPU command lists, every time we enter a breadcrumb scope and exit a breadcrumb scope, we insert on D3D12, for example, we use write buffer immediate to insert an integer right into the command list stream. And those integers get written to a buffer that persists

even if the GPU crashes. There's some mechanism in Windows that allows you to get that data back. So what we can do is basically the GPU is marking how far through the frame it got the whole time it's running. And then on the RTI interrupt thread, when we see that the GPU has crashed, we get the device removed error, we jump into the crash handler, and we can pull back those integer values and then look through the list of work that we know was in flight on the GPU that we haven't completed yet, find the corresponding range of markers, and then dump that to the log. And again, because we're multi-GPU, multi-queue aware, you'll get one of these dumps per queue.
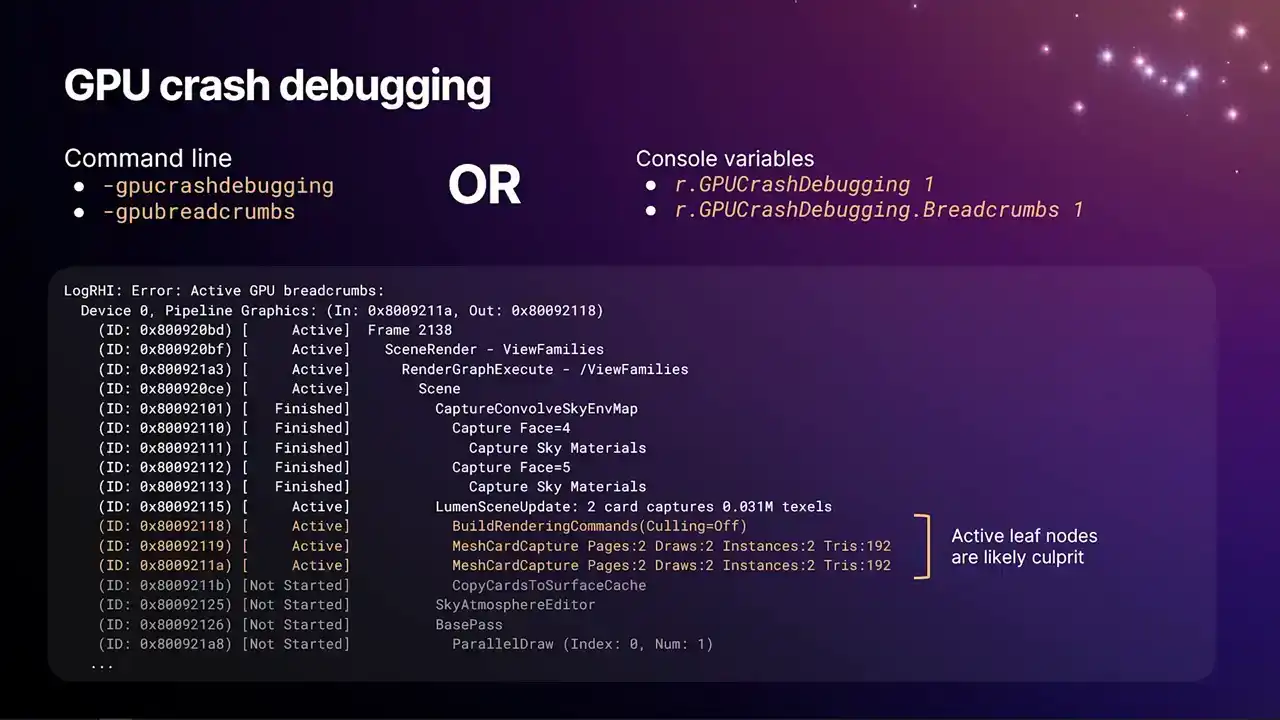
And so the example here was some particular. It's really handy. When I was putting these slides together, someone had a GPU crash in Lumen. So I just stole the log, and then could dump it into here. We do have a debug GPU hang test command, but it's a bit of a contrived example you used to see is like GPU crashed bug hang. That's the past that crashed. Surprise, surprise. So in this case, it was something in Lumen that was crashing. And the likely culprits are going to be the ones that are the most indented nodes that are still marked as active, which we've highlighted in orange here. But the one thing to be aware of, oh, yeah, so the stuff that's highlighted in gray there, we know that we've not started that because the GPU hasn't, the command processor hasn't emitted that break-run marker in submission order yet. So we'd know that's not the culprit. It's something before then.
One thing to be aware of is that some hardware can report completion of work, even though it's not actually completed. There can be memory operations that are still in flight that might still cause a page fault on the GPU. So some of those nodes there that are marked as finished, take that with a bit of a pinch of salt and maybe gather multiple repros and see if there's a pattern of whether or not like that upper bound changes a lot. OK, so that's pretty much everything.

I hope all the information here helps you guys with profiling your games and resolving all your horrible CPU and GPU bottlenecks.
Thank you very much, and I'd like to open the floor to Q&A.