Integrated-Insights--Automating-Performa
https://youtu.be/Hr79E6vK74c?si=jVZK5BOujkDnwil3
Hello, everyone. Please write down any questions that you have for us. Around the end, we'll be around also afterwards if you've got anything else.
So we're here to present our talk called Integrating Insights, Automating Performance Capture on Marvel 1943 Rise of Hydra.
My name is Marios. I'm an engineering director at Virtuos. And I'm joined by Steven, a technical director at our studio Black Shamrock.
So today we're here to discuss how continuous monitoring can transform your approach to optimization and performance.
We're going to share some learnings with our collaboration from Skydance Games and how the tool evolved to tackle specific challenges.

So today, hopefully, you'll come away with an idea of how you might build something similar and how it might be applied to your projects.
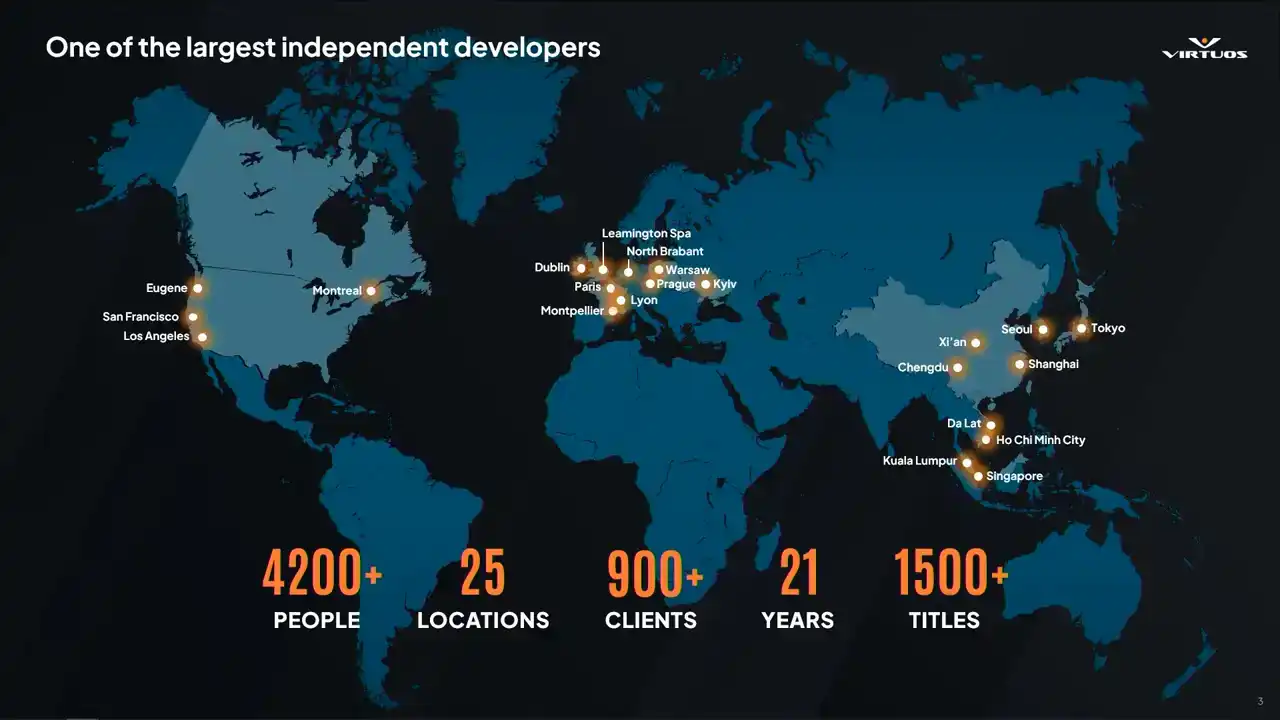
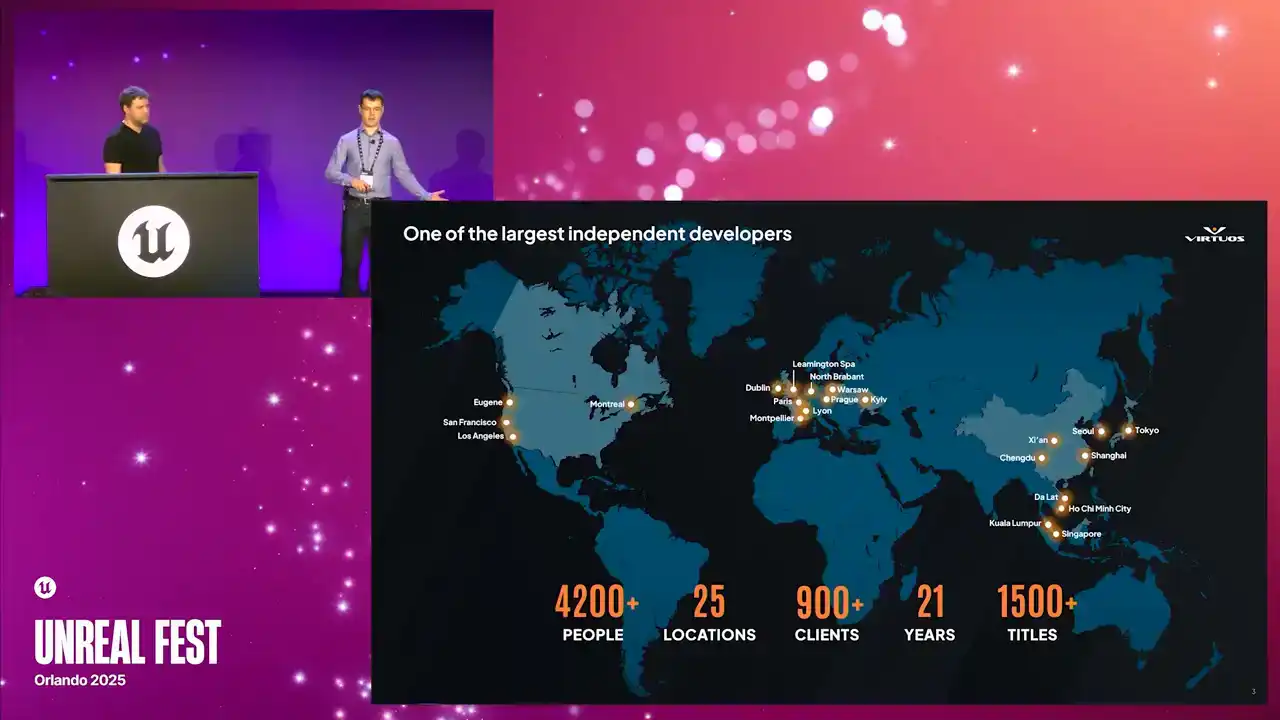
Quick info on Virtuos. So we're a large code dev company. So this means that we're exposed to many different teams and dev approaches. We've worked on 1,500 games, most recently released the Oblivion Remastered. Stability tracking seems to be quite common from what we've seen across projects.
However, performance tracking has been lagging behind. Cool. So as Marius mentioned, I'm a technical director. And one of the favorite things I think about that job is that I get to share some of the really cool things
that my teams work on and that we build. So that's what we're going to do today. We're going to share some of the tools.
We're going to share some of the learnings that we've made. And hopefully by doing that, we might change a few of you guys' mind in our thinking about how performance monitoring can be applied in your own projects.
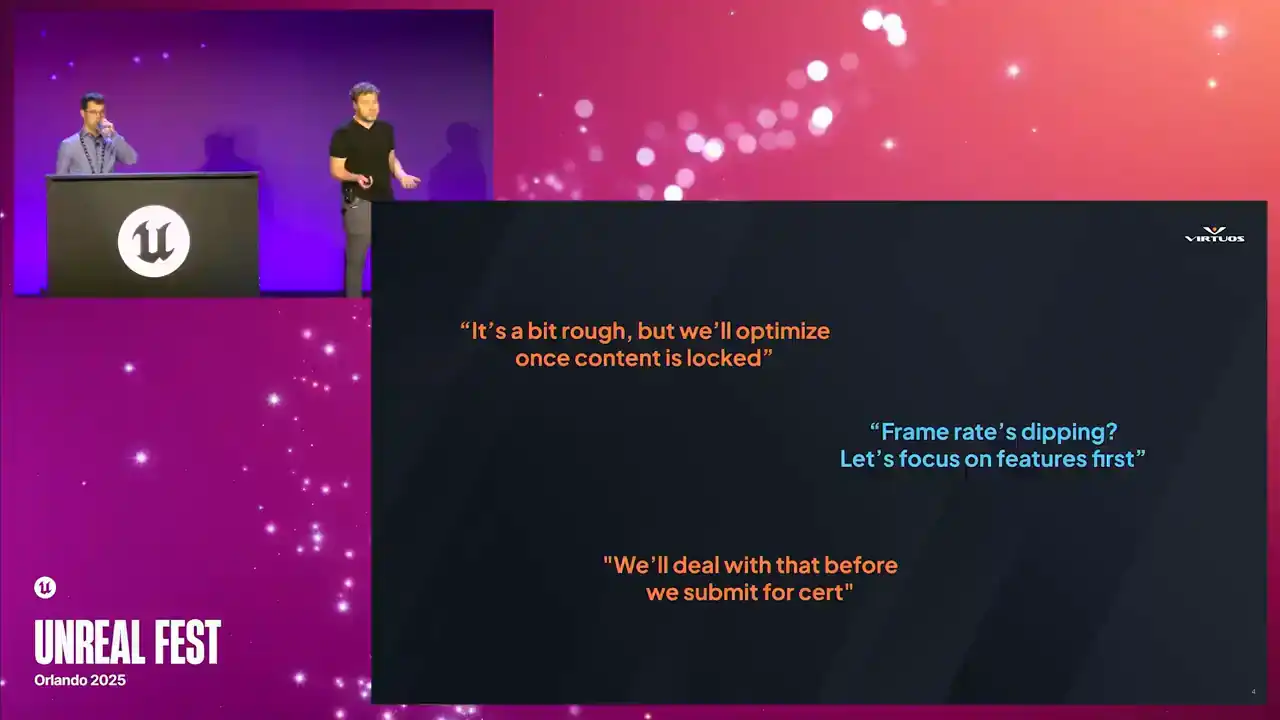
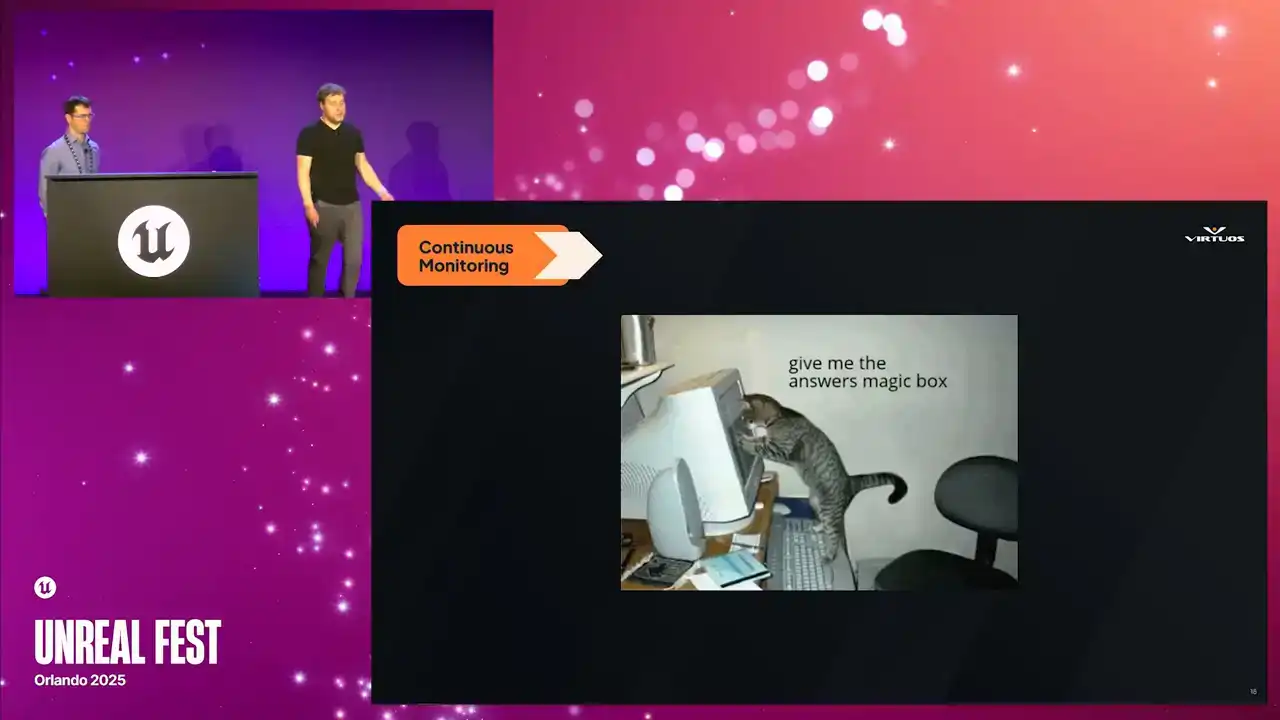
So let's maybe start by understanding a little bit about who's in the room here today with us. So maybe by a show of hands, if we're feeling energetic, who's been on a project there? You've heard things like this.
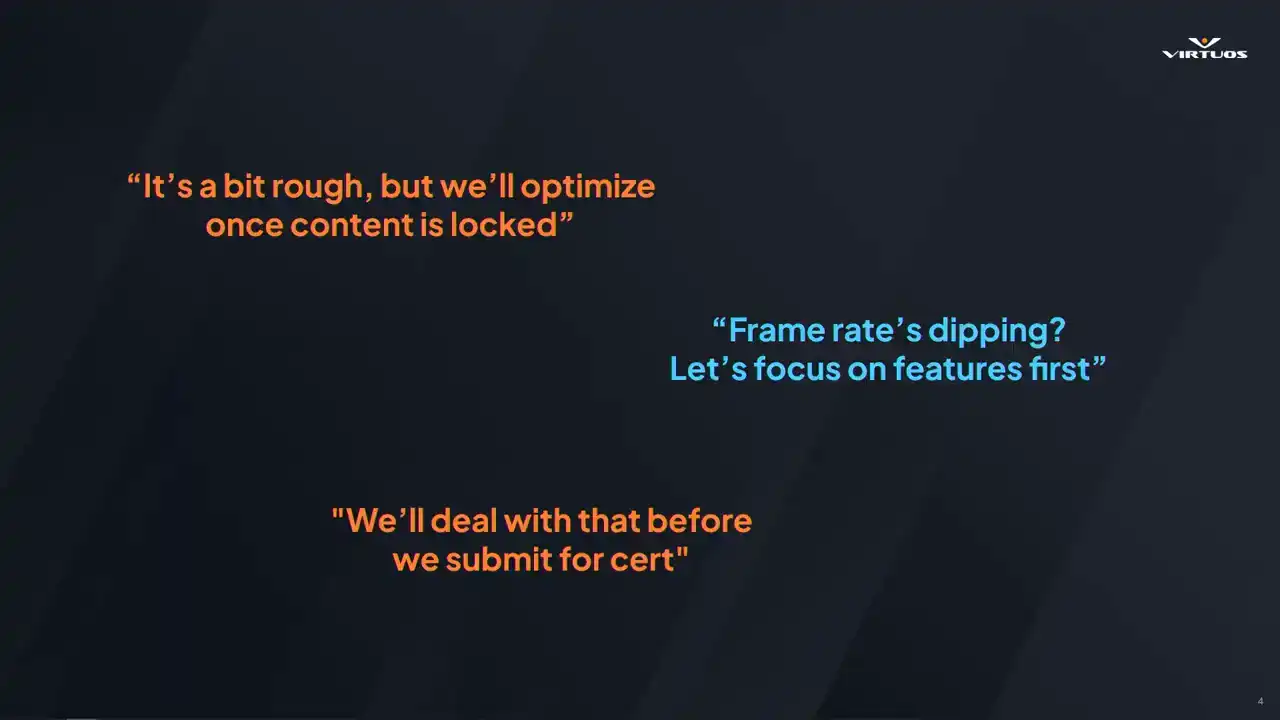
Or maybe you guys have used them yourselves, right? And it's a bit rough, but we'll optimize once content is locked. We've got a few. The frame rate is dipping, but we're going to focus on the features first.
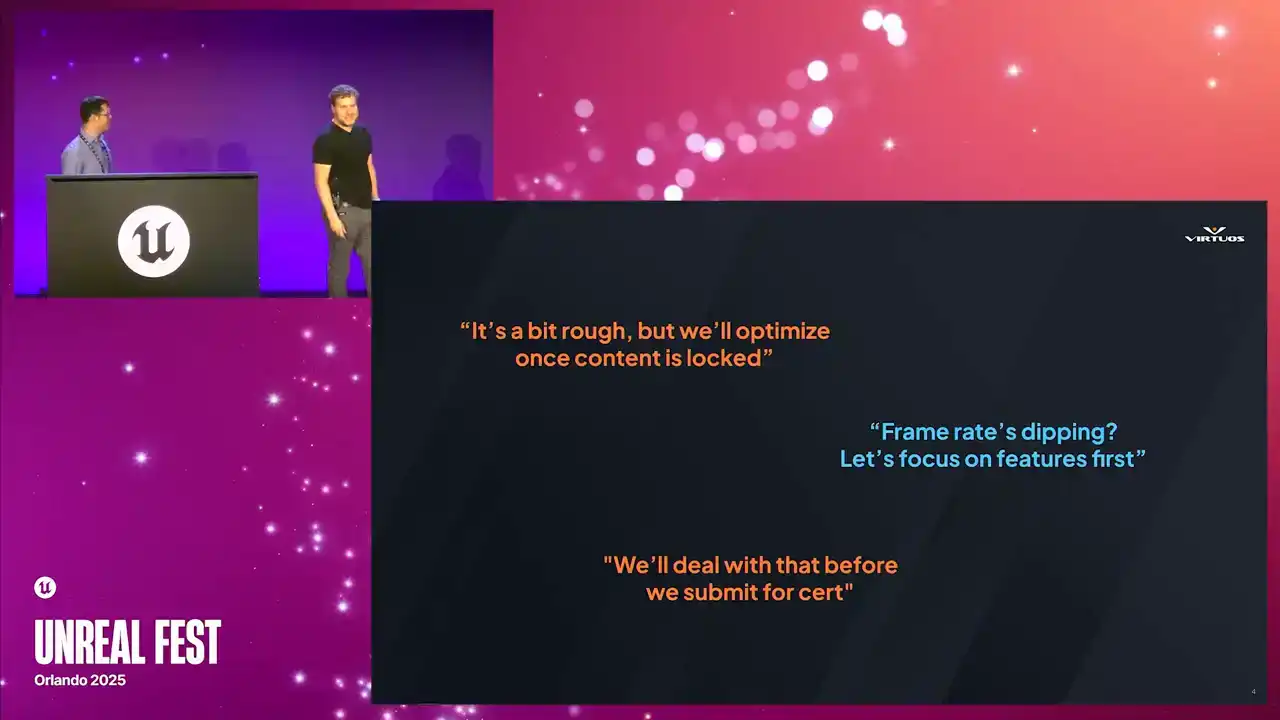
Or we'll deal with that before we submit the search, the famous last words.
So I see we've definitely got a few people who've seen these on their projects. And that really rings true to our experience as well on all of these codec projects. We get to see really across the board how people approach development.

and to be honest, performance is always a pain. So what we really want to go ahead and get ahead of that problem, and thinking about performance throughout our production cycle.
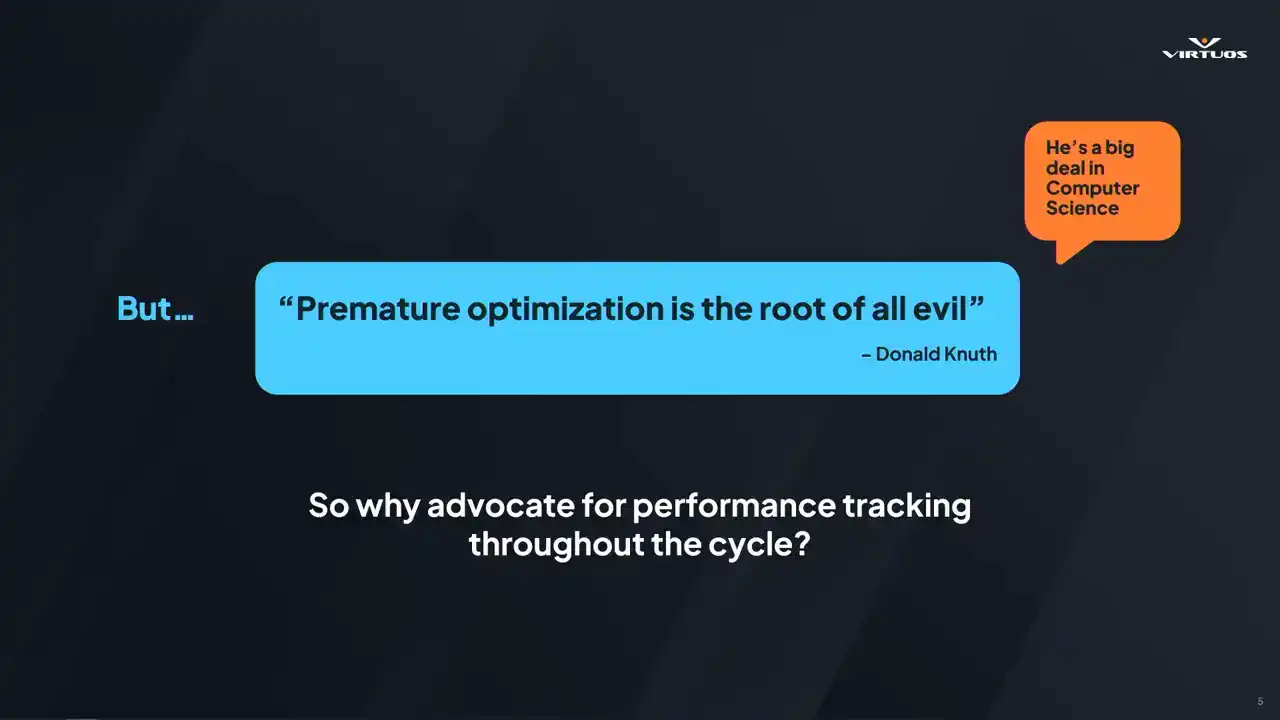
But I hear you say, premature optimization is the root of all evil. And that was written by Donald Noose. He's kind of a big deal in computer science. He wrote the book. He wrote many books on the topic.
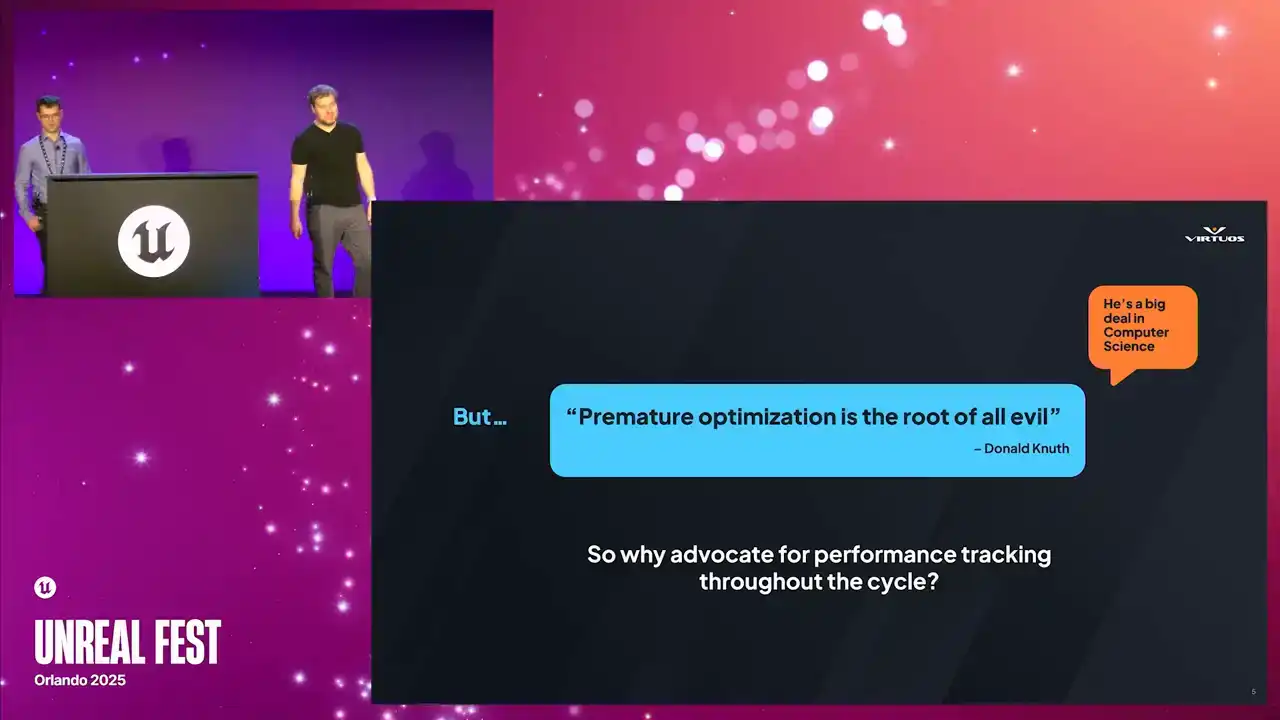
So who am I to be standing up here in front of you guys saying anything different. But I have good news for you, or good news for me at the very least. I think Newt is actually on our side all along in this conversation. So this quote is from a book called Structured Programming
with GoToStatements. So that shows its age a little bit. But when we actually dig into that book and we look at what Newt was saying in a bit more detail, I think it becomes a lot more clear. So I'm paraphrasing a little bit here. but what Newt said in the book is, programmers waste an enormous amount of time thinking about the speed of non-critical code in their programs. So we should forget about small efficiencies most of the time, because premature optimization is the root of all evil.
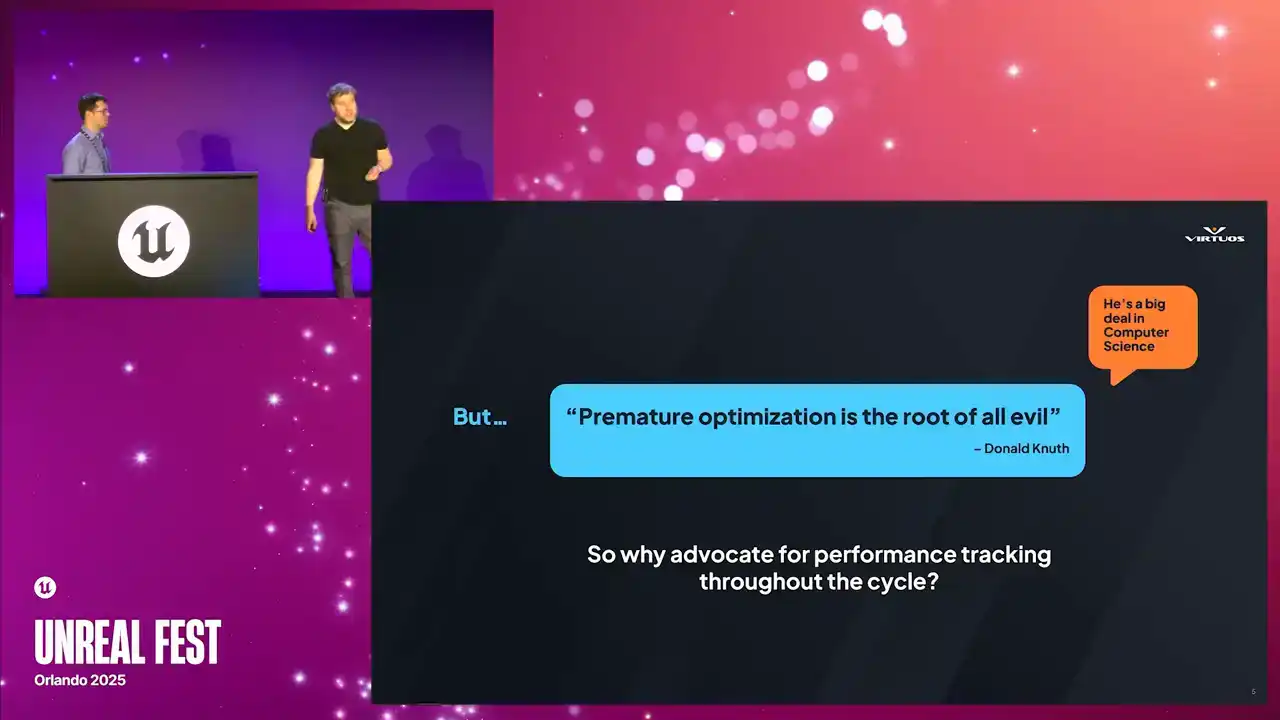
But he goes on to say that a good programmer should look closely at critical code once that critical code has been identified. So that book was published in 1974, and I think it's still relevant today. What's also true is that despite the massive increase in complexity, understanding the performance of our code is still largely a manual process that hasn't changed drastically over the time.

Our tools have improved, but the process itself is pretty similar. So why are we here advocating for performance tracking throughout the dev cycle? We think change is needed. And our call to action really is that if we can automate away the process of identifying in that critical code, we get better visibility to optimize at the right time in your project. So how do we do that?
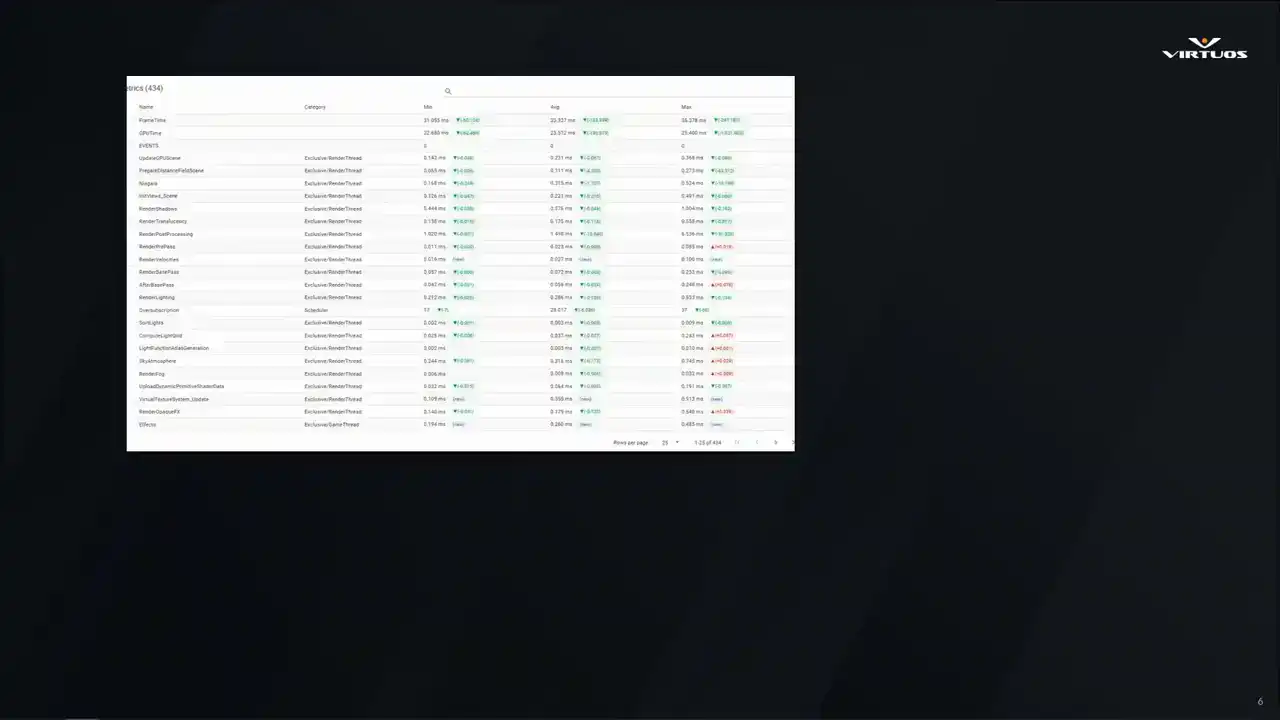
Well, we build tools, of course. Here's a little preview of what we'll be showing. We wanna be able to understand the detailed metrics about your project, visualizing the key health in a useful way across your game,
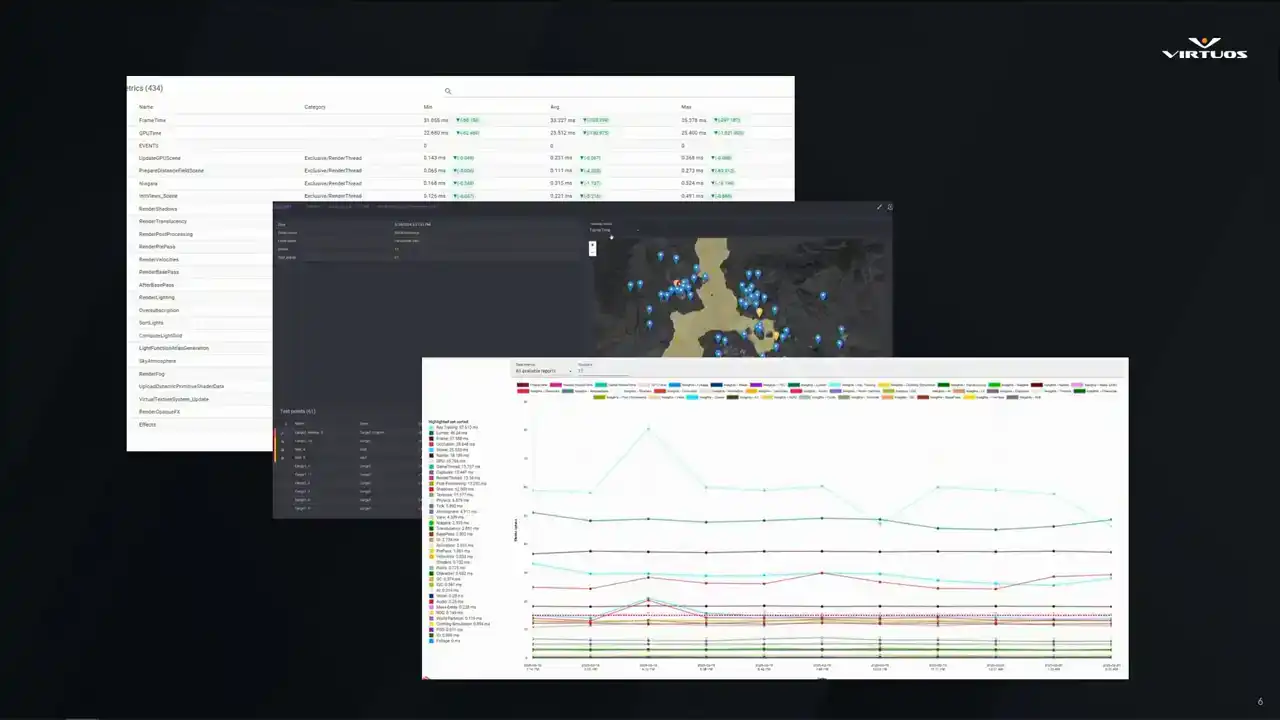
and tracking performance over time throughout the project.
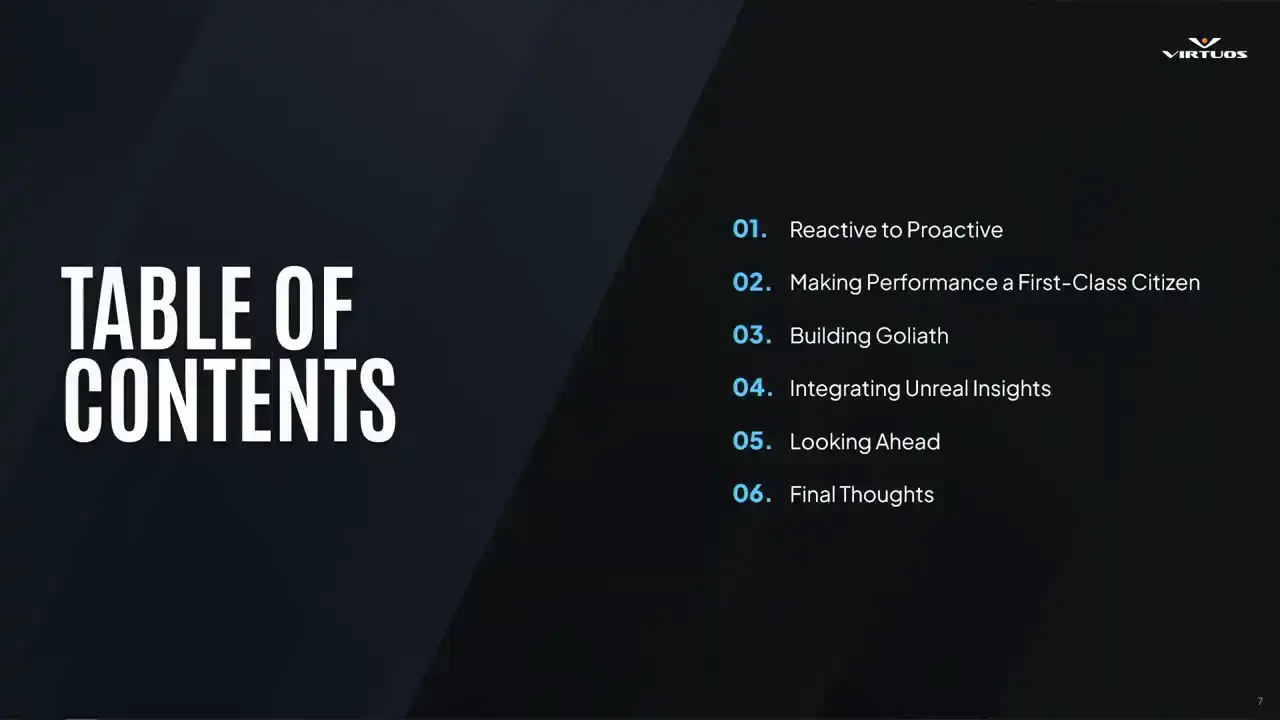
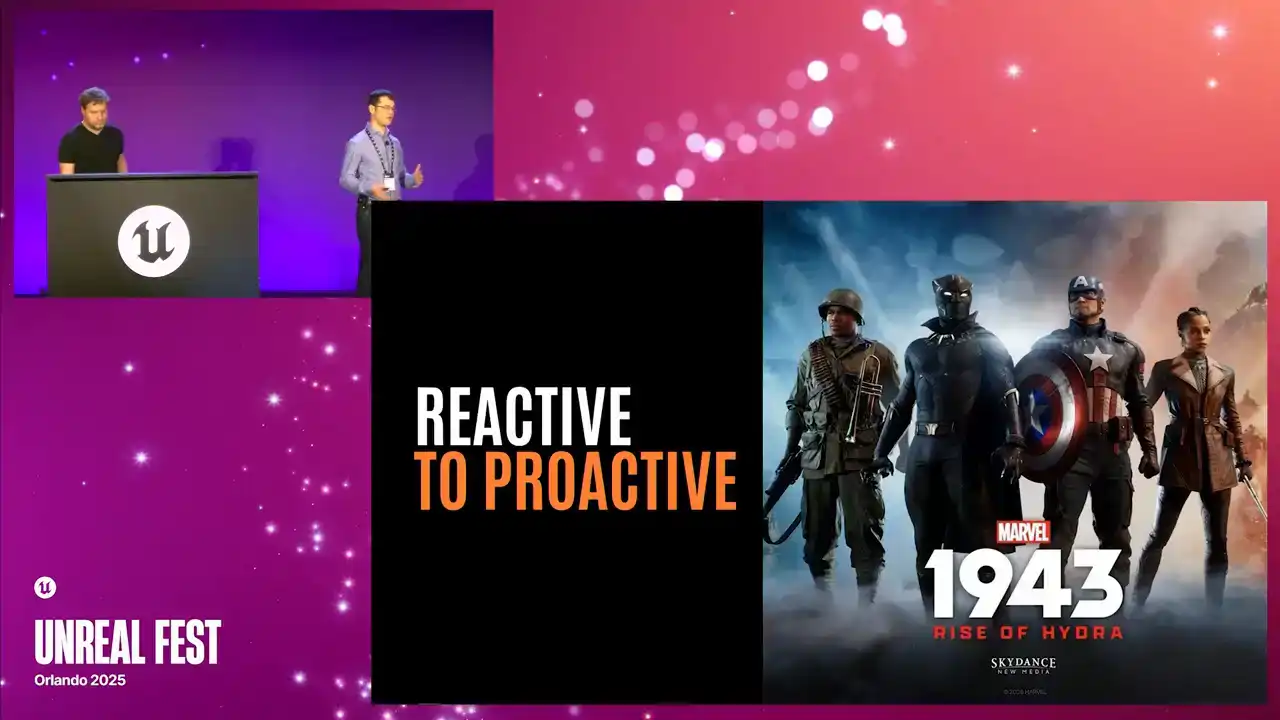
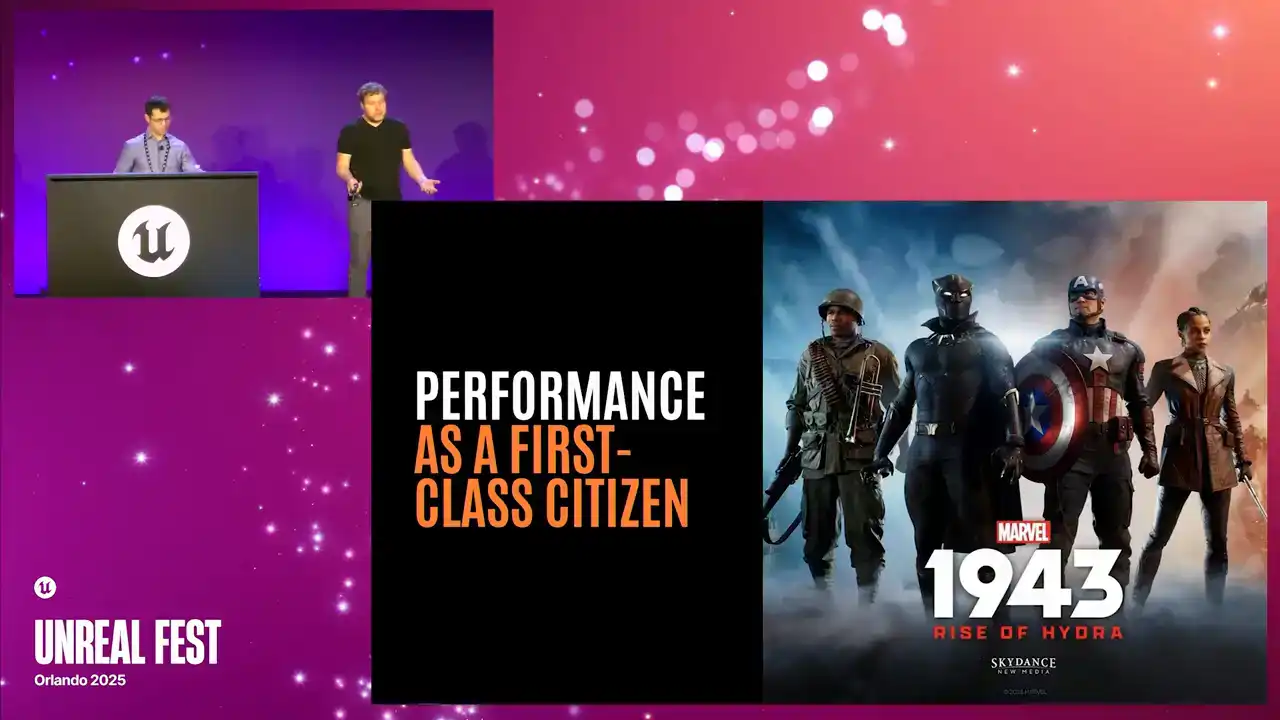
All right, so our talk today is broken down into six sections. First, we're going to talk about this shifting mindset, moving from a reactive to a proactive approach to optimization. Then we'll talk a little bit about our collaboration with Skydance and how we would like to make performance into a first-class citizen.

Then we'll talk about some key components that make up Goliath and ideas on how you might approach it in your own projects. We'll discuss one of the main features, which is the integration with Unreal Insights. Then we'll look at where the tool is heading next and wrap it up with some final thoughts.
So we really hope to change how you think about optimization on your projects. We're here to share our ideas. And... Yep we here to share our ideas and make things more sustainable Sorry about that We here to make the game development better for everyone And hopefully from this you spend more time on finding the fun
than thinking about all of the optimization problems that come later. So let's take an example.
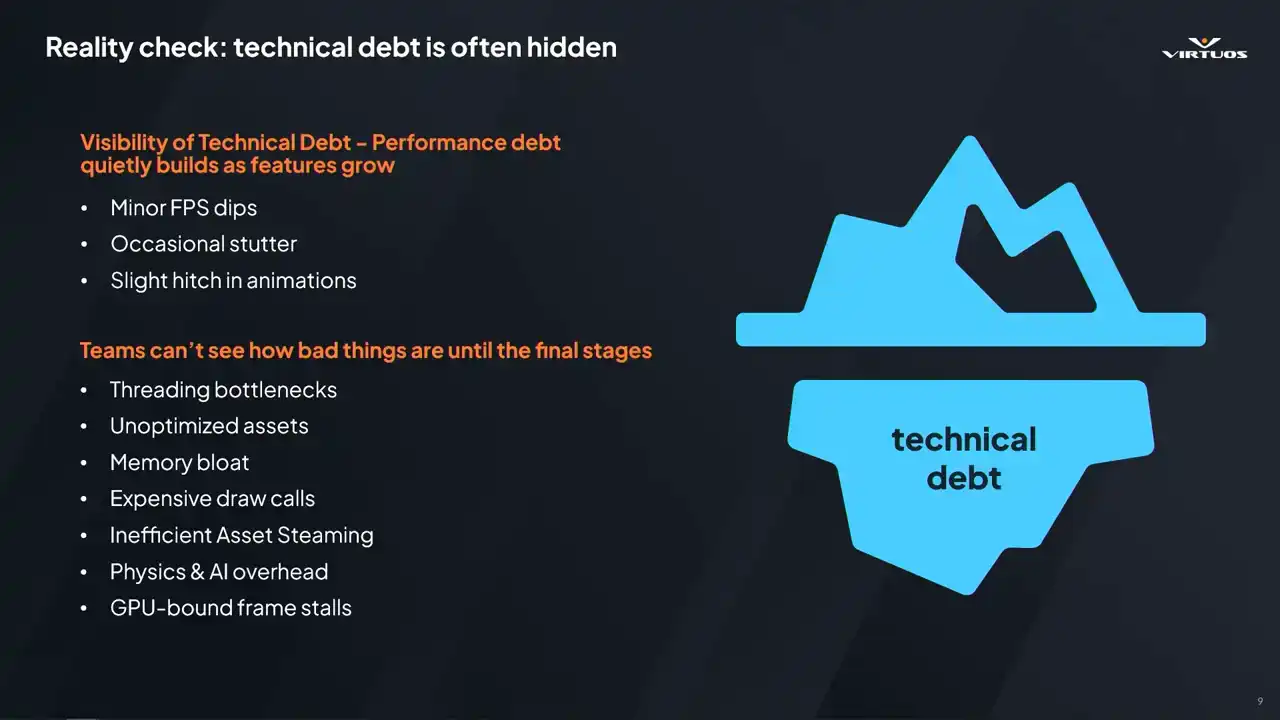
Production starts, features are filing in, you're getting deeper and deeper into production. There's new rendering tech, AI logic, reworks, maybe there's some production assets coming in, lots and lots of assets. There's that performance creep. But the debt remains hidden. It's underneath that glacier. There are minor FPS dips and stutters. These are all symptoms of the problem.
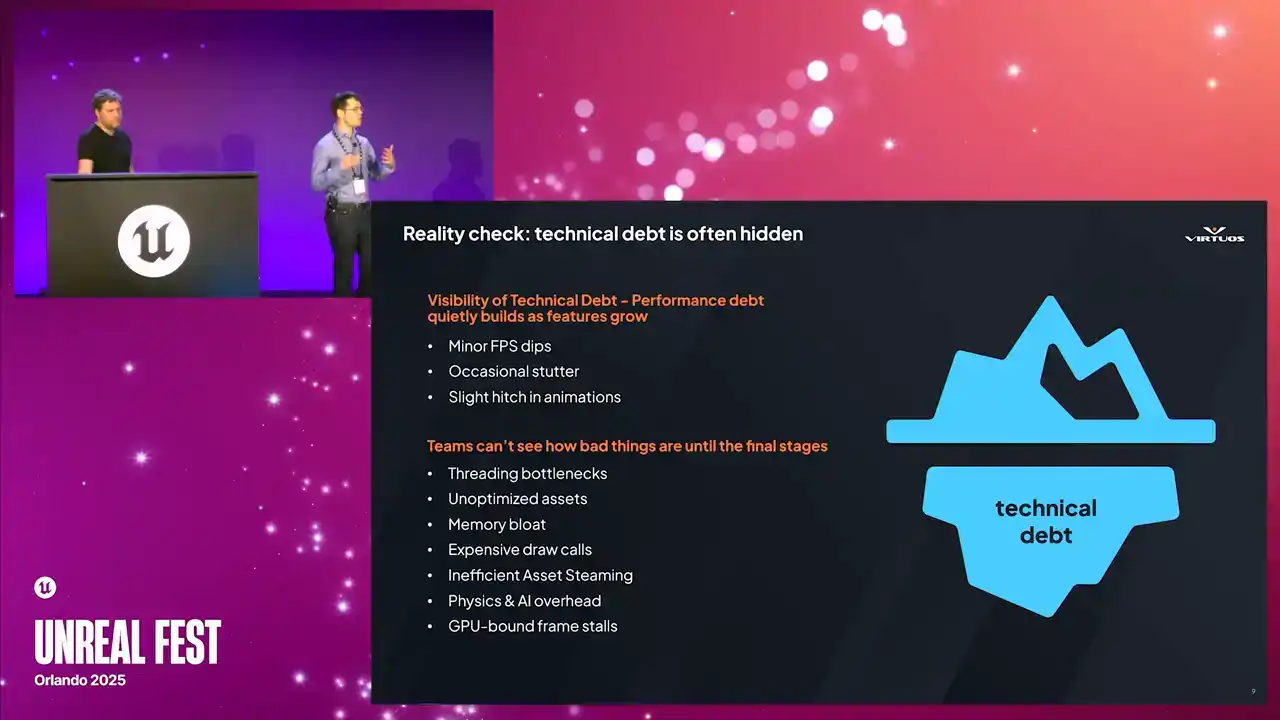
And you start looking more deeper. Maybe you see there's poor thread utilization. There's memory allocators that are not incorrect. There's inefficient asset streaming. And these become incredibly expensive to fix the later you are in production. And so performance really isn't just about efficiency. It's also about stability and the predictability. having the visibility and what it looks like into the future, especially once you reach alpha or beta. So Stephen already asked, how many of your projects suffered because optimization was thought about too late in the process?
You know, we don't ship games with game-breaking bugs. I mean, that's really something we fight against. So why do we roll the dice with optimization, right? So the real challenge here is, how do we anticipate the problems that come later, just earlier on in development?
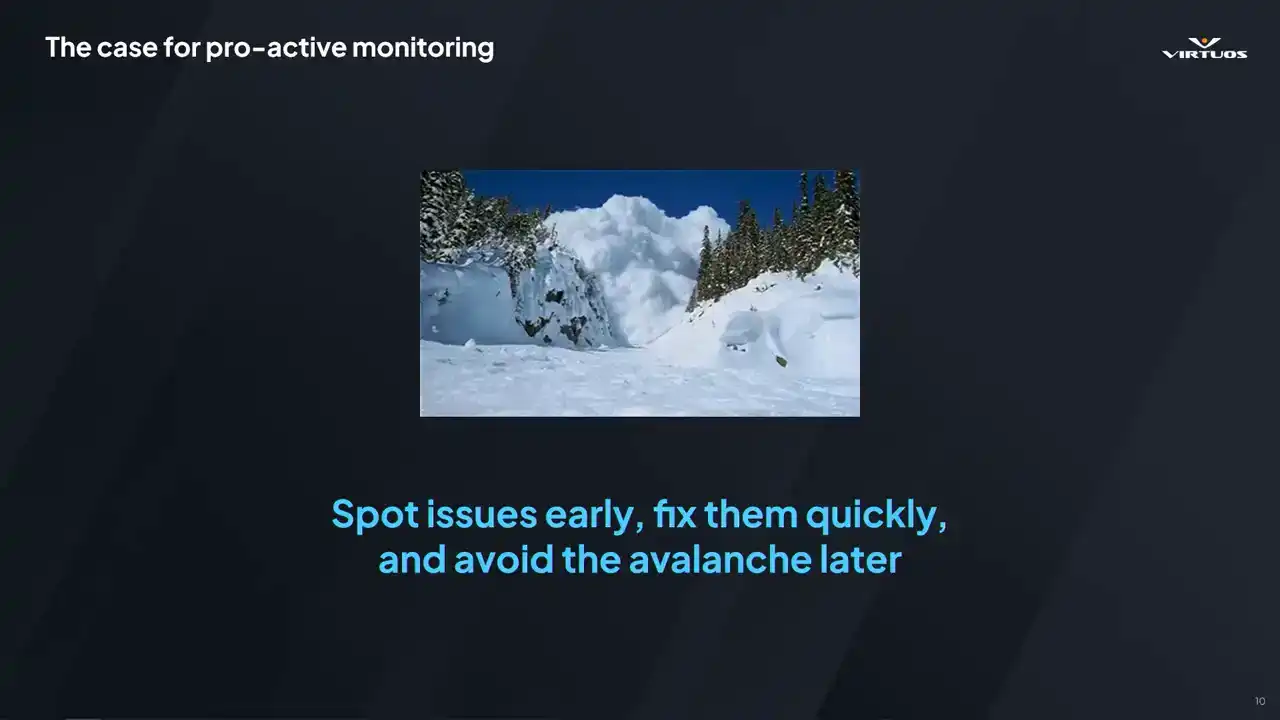
it. All right. Bear with me as we keep with these freezing cold metaphors. We're developers. We're not poets. So spot issues early. Fix them quickly. In doing so, you really reduce the risk of the project. You reduce the stress on the team. And you have the time to focus
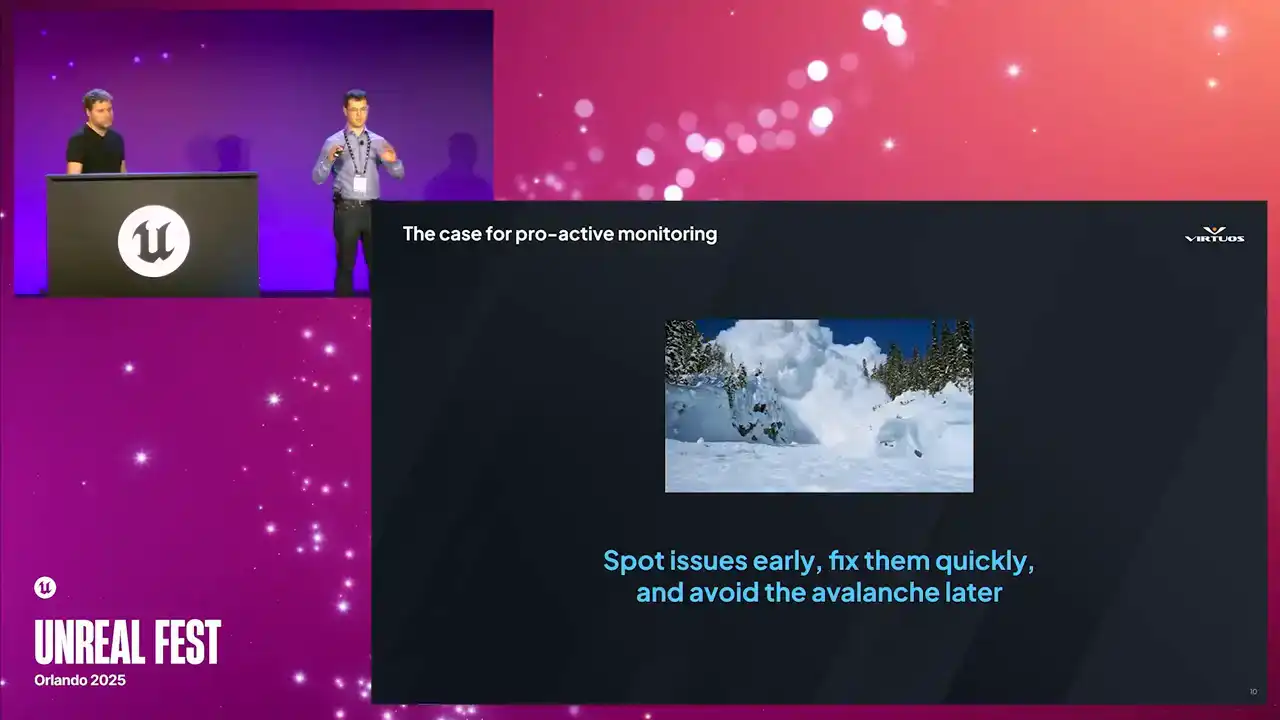
on that feature dev. You get the visibility from day one. And you avoid the avalanche of bugs that come later. Or at the very least, you have visibility on that avalanche of bugs and you can plan for it accordingly. So treat performance like stability,
bake it into your daily processes, means fewer surprises and a smoother production cycle.
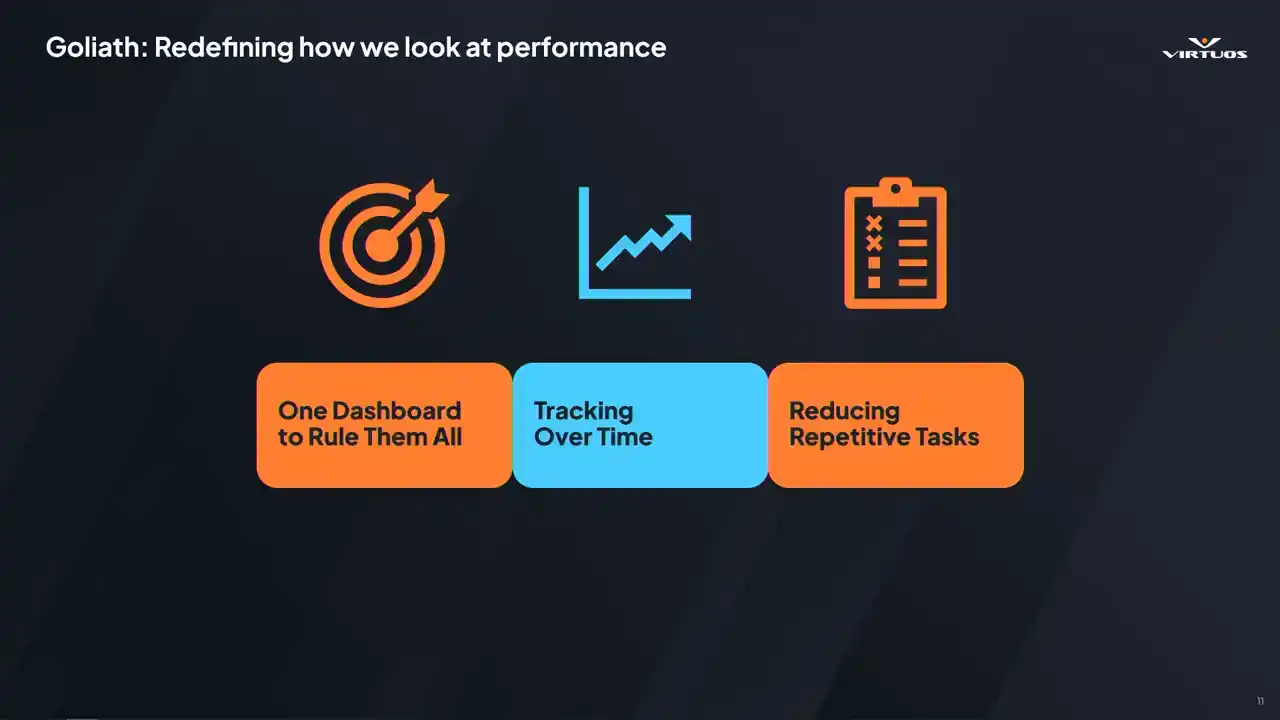
So as codev, we have seen the struggles of many projects and we face these issues over and over again. So let's think of ways to kind of resolve that. So we're kind of structured things in three different ways or three main points to this. First of all, have one dashboard to rule them all.
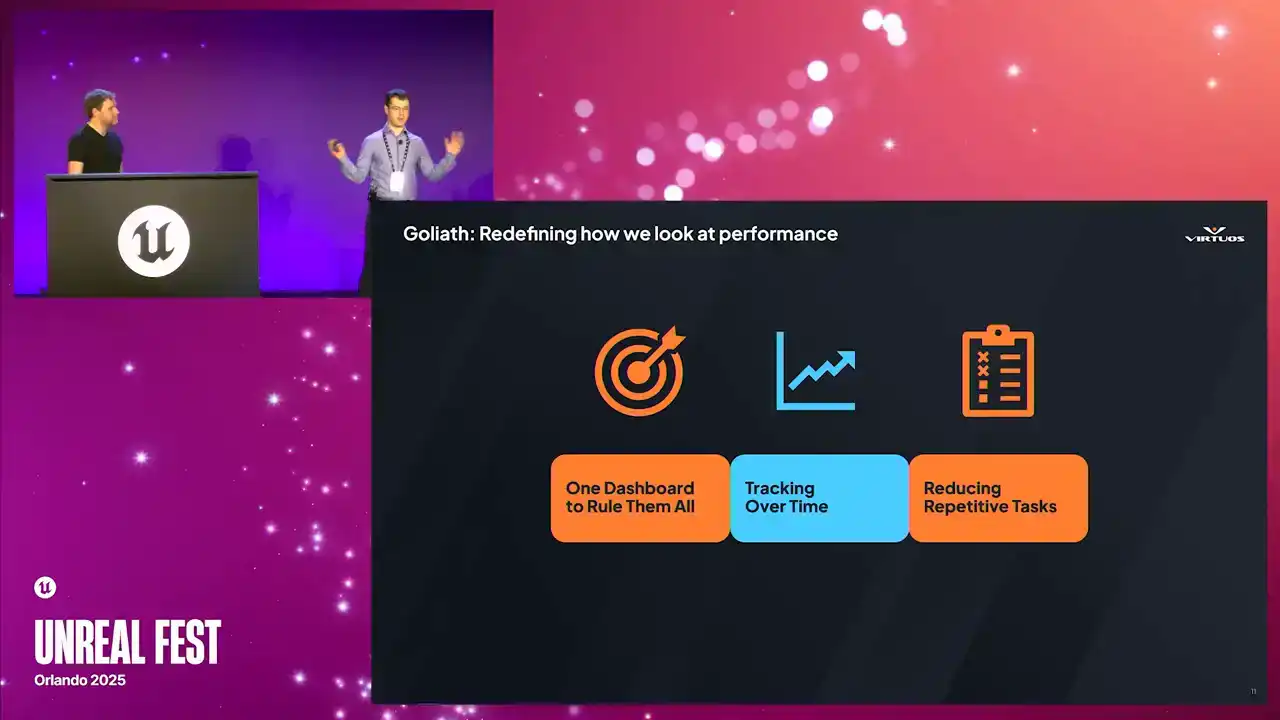
So one specific place that everybody can go, single source of truth. You don't have scattered reports everywhere or custom tools measuring this and that. Everything is in one place. Secondly, performance is not static. It evolves over time. So let's track it. Understand the relationship, the cause, and effect of your changes. And lastly, efficiency and consistency. So reduce those repetitive tasks. Instead of asking engineers or different developers coming and saying, can you do a profile here, can you do a capture here,
can you tell us what it's like? Well, by having it automated, it's just easy and it happens all the time. So, out of this, Goliath was born. Cool, so at this point of the project, and we've been working with different people,
we have an MVP of what we want to put in place, and we still have an understanding of where we really want to go with a product like this,
least the core pillars of it. We've seen the challenges across multiple studios and teams, and so we know the idea has legs. But what we needed at this stage was the right partner to really put it into practice. It was around about this time that we were connecting with the team
at Skydance Games, and luckily for us, they really shared a similar mindset in terms of performance monitoring. They were already thinking of this in a similar way. They understand the value of having that visibility, that tracking, and performance considerations right alongside their feature development. And even better, they embraced the idea of this collaboration, not just building the tools for themselves on a once-off basis, but helping shape a tool that could benefit other teams and the community as a whole and get that lovely cycle along with it. So that's the partnership that made this whole process possible.
I'm going to hope this video plays.

please just stick to the rooftops be careful stand was on me when am i not

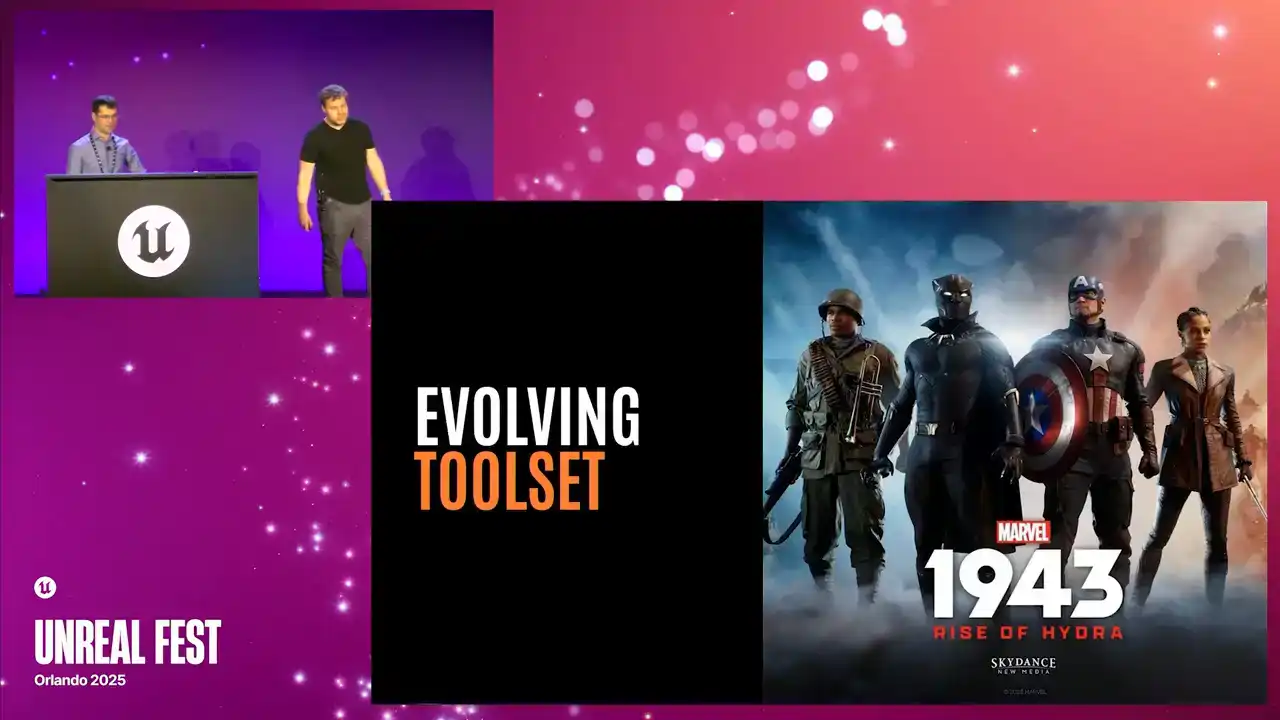
it's better if i tackle this one alone who the hell are you that's far enough stay out of my way All right, so that's just a little bit of a taste of the game, but isn't it cool?

I mean, I hope you guys have seen this. It was at the Unreal Fest last year, or at State of Unreal last year. So we got to see a bunch of the footage, but even from that short clip, we can see that
this is really a AAA cinematic experience. The game is action-packed. It's creatively bold. And from a technical perspective, this game is really pushing the limits of what Unreal can do. It's built on the latest and greatest features, and every moment, every cutscene, and every action beat it needs to perform when the game is released. And that makes it the perfect environment to test our approach. It's high stakes, and the team is consistently raising the bar on the visuals and the gameplay. And performance can't be an afterthought in a situation like that. It has to be baked in from day one. So let dive into how we brought performance tracking into the production cycle on Rise of Hydra And let play the video again All right
So when building a performance pipeline, we knew we needed a way to continuously capture detailed performance data at key points in the game. Instead of relying on ad hoc testing, we wanted a structured, automated approach that we could run consistently throughout production. And setting this up involves four key stages.
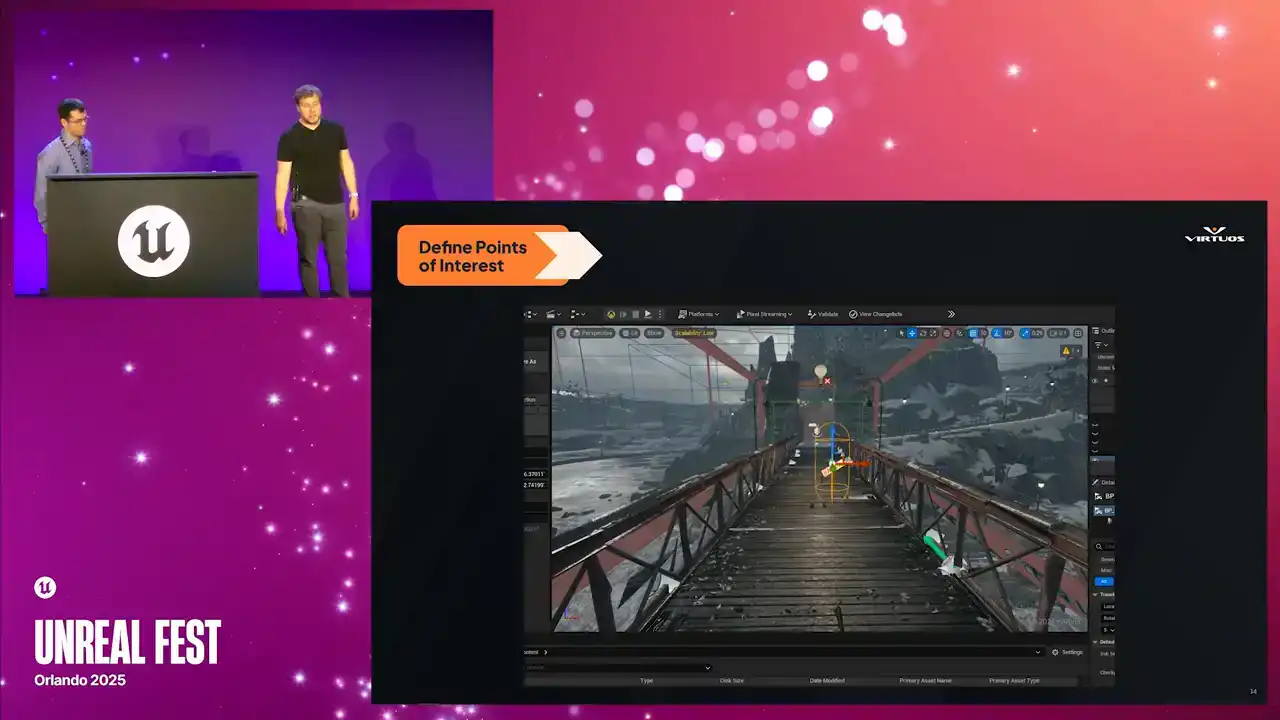
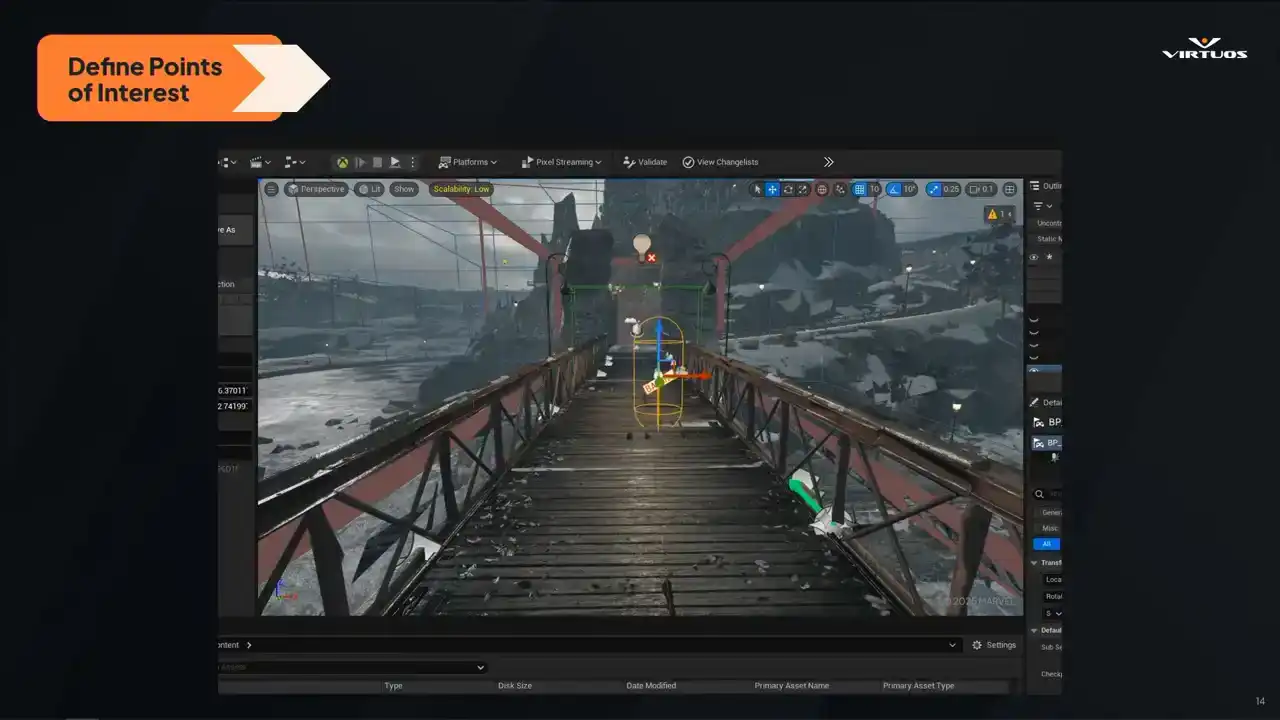
Step one is identifying those critical parts of the game, where performance really matters. These are the moments that need to be bulletproof. The cinematics, intense gameplay, complex lighting setups, high density scenes. And this really isn't just a technical approach. We also need to listen to our design, our art, our animators, anyone who knows what areas of the game are going to be pushing it hard. So in this case, we're looking at the bridge scene just from the trailer there. It's a point where Captain America and Black Panther clash. You know, it's visually impactful. It's a really important gameplay moment, and it needs to run flawlessly. So we pick this as a key moment, we flag it, and we track it. Right from the early builds through to the end of production. So I'll just point out if I have a laser pointer here, this little capsule, So keep that in your mind, we'll come back to it in just a second. And of course, in a game like this, there's no shortage of targets. You've got the large draw distances up on our, whoop, I don't know how to use these things, but our large draw distances from these rooftop scenes,
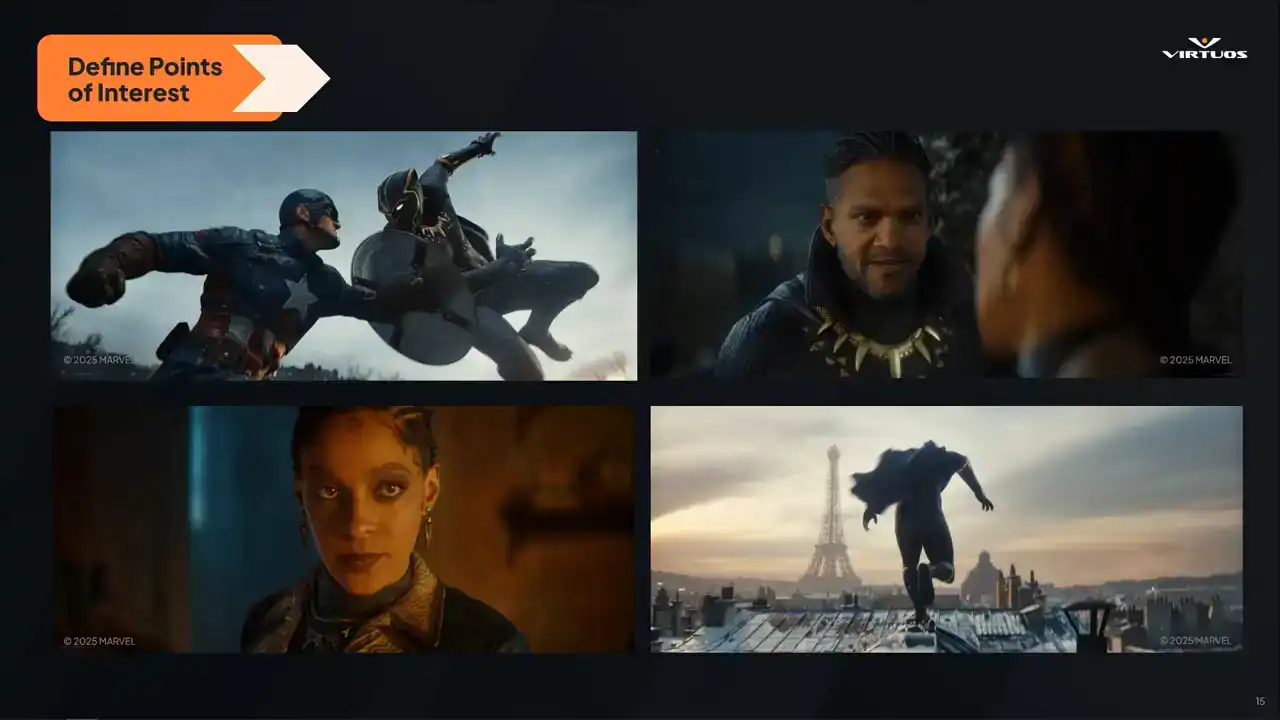
got our fast paced action, got our super detailed and really nicely lit characters. And really, there's also value in setting automation and testing for our dedicated test environments. So things like isolating AI, physics, and lighting in controlled spaces and test gyms.

So the point here is to build broad coverage, but yet targeted profile of the key areas of the game. The reality is we can't profile the whole game at all times, so we're focusing on the parts that really do matter.
And we're doing it in a structured way, with it being consistent and repeatable measurements over time.
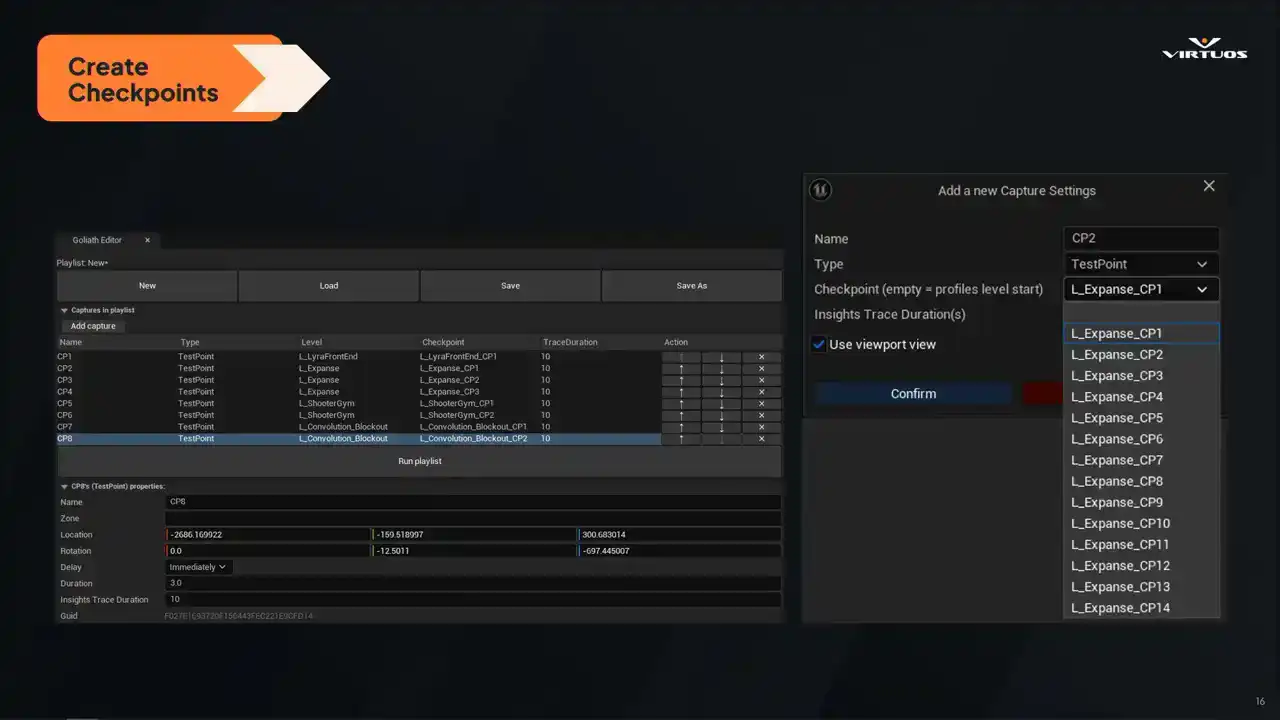
Once we've defined our key points of interest, we set them up in checklists directly on the level. So the capsule that I just pointed out is how we inject it right into your level. Each checkpoint marks a specific location in the game where we want to capture that performance data. They're placed just like any other elements on your level. We have a location, the direction that they're facing, the direction that they're facing, and the duration of the capture
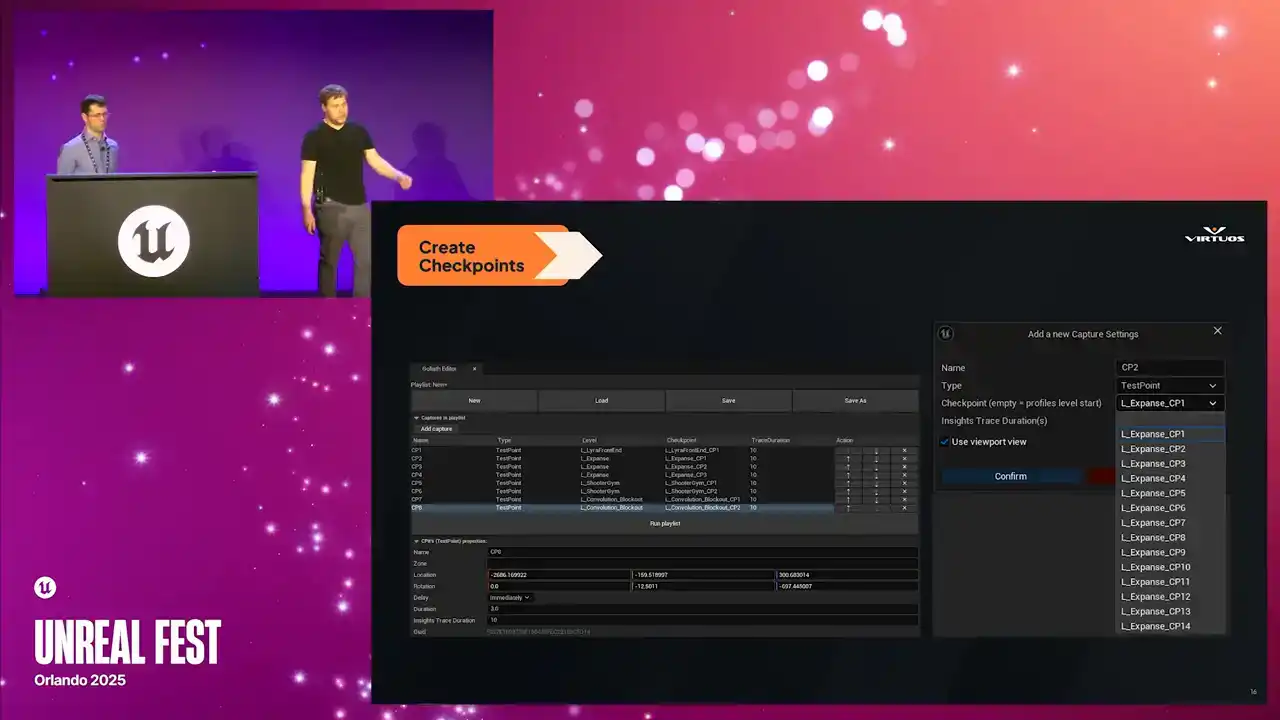
that you wanna take into account. Checkpoints are then rolled up into our playlists here. And playlists are essentially just logical groups that we can trigger as we need. The important part here is it's lightweight, it's not invasive, it's easy to drop in, and it's easy to maintain.
And once these checkpoints are in place, we automate the entire process. Every time a new build is created, it runs through the same scenes and captures those same checkpoints and same data. It's completely hands-off.
There's no extra steps for developers. There's no chance of forgetting to run a test. The system just works. And because it runs the same way every time, we avoid the usual question marks, performance capture. Was that a debug build or production? Did I revert that physics tweak that I had running? Was the camera even pointing in the same way?

that tree in the frame the last time I ran the performance capture. That consistency means that we trust the data and we spot real trends, not noise.
And finally, the value of a system like this is realized when that data is consistently reviewed. At Skydance, multiple teams are monitoring the historical performance trends in these dashboards
and allocating tasks based on that data. Some teams check key performance weekly, while others dive into trends when specific problems arise. Regardless of the cadence, the key benefit here is that the data is always available without requiring that manual collection step.
That's what makes this approach the real game changer. We've moved from that reactive approach to a proactive approach, ensuring the performance is monitored and optimized throughout production.
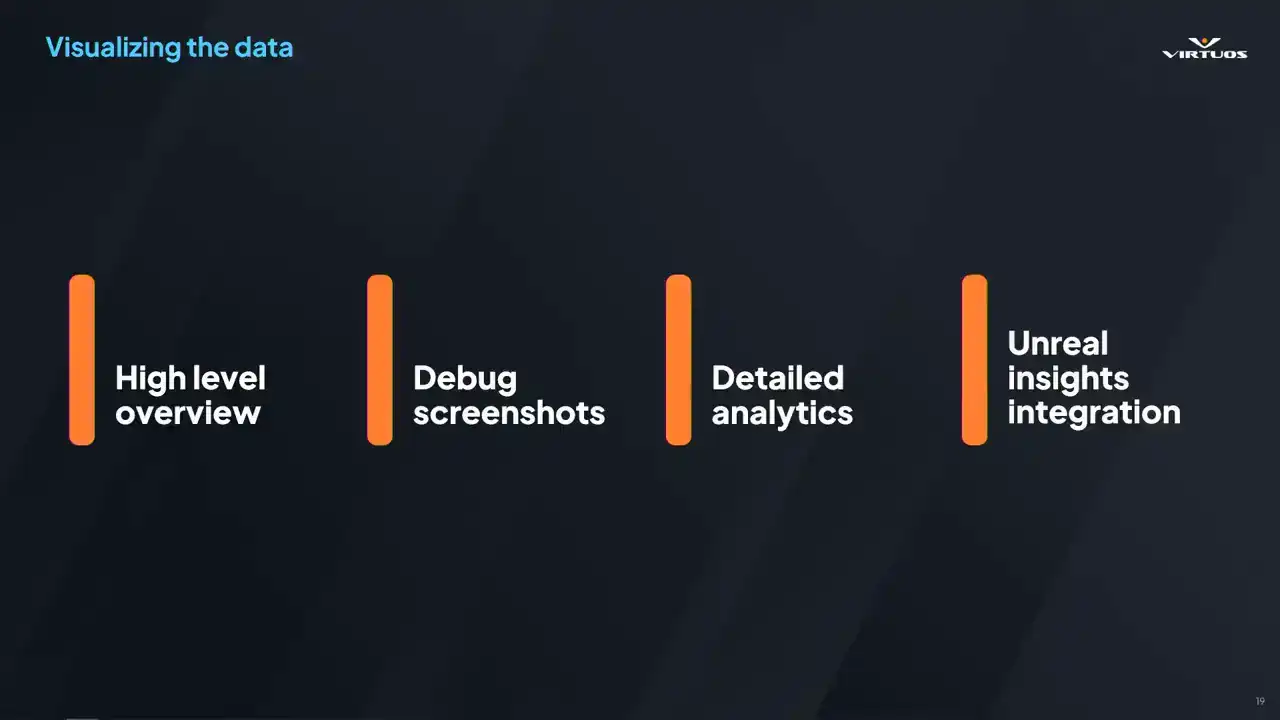
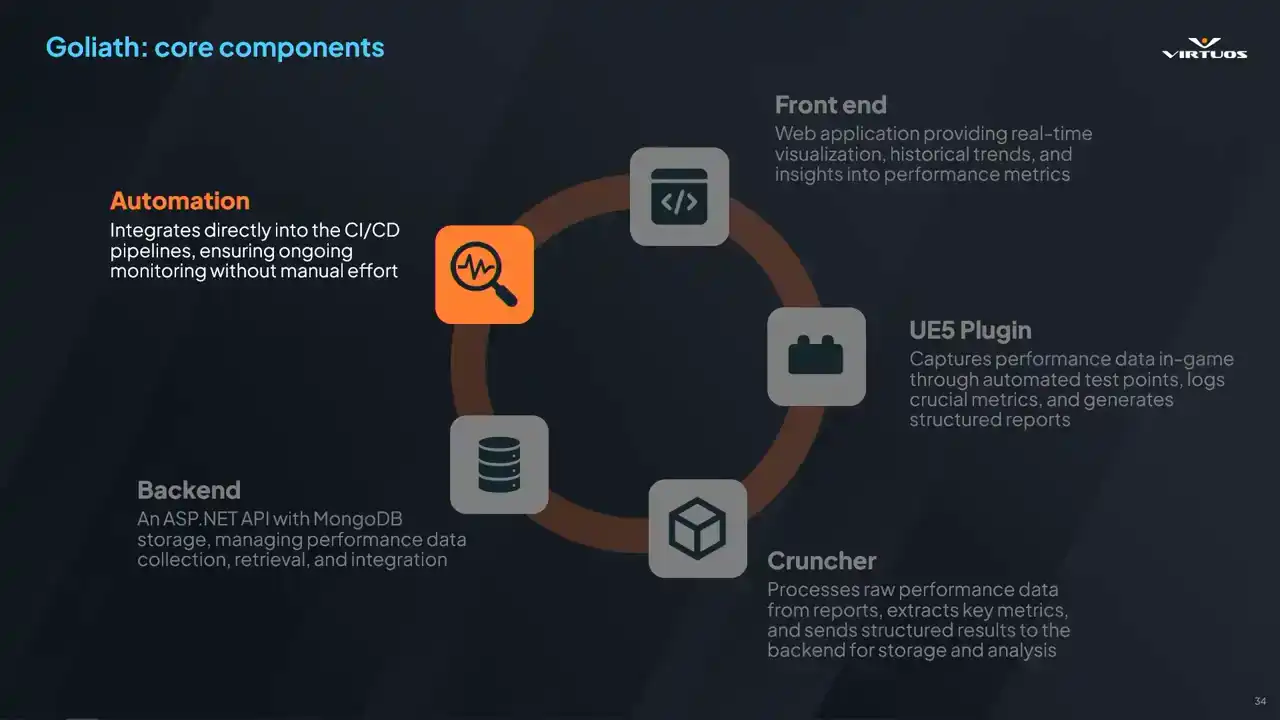
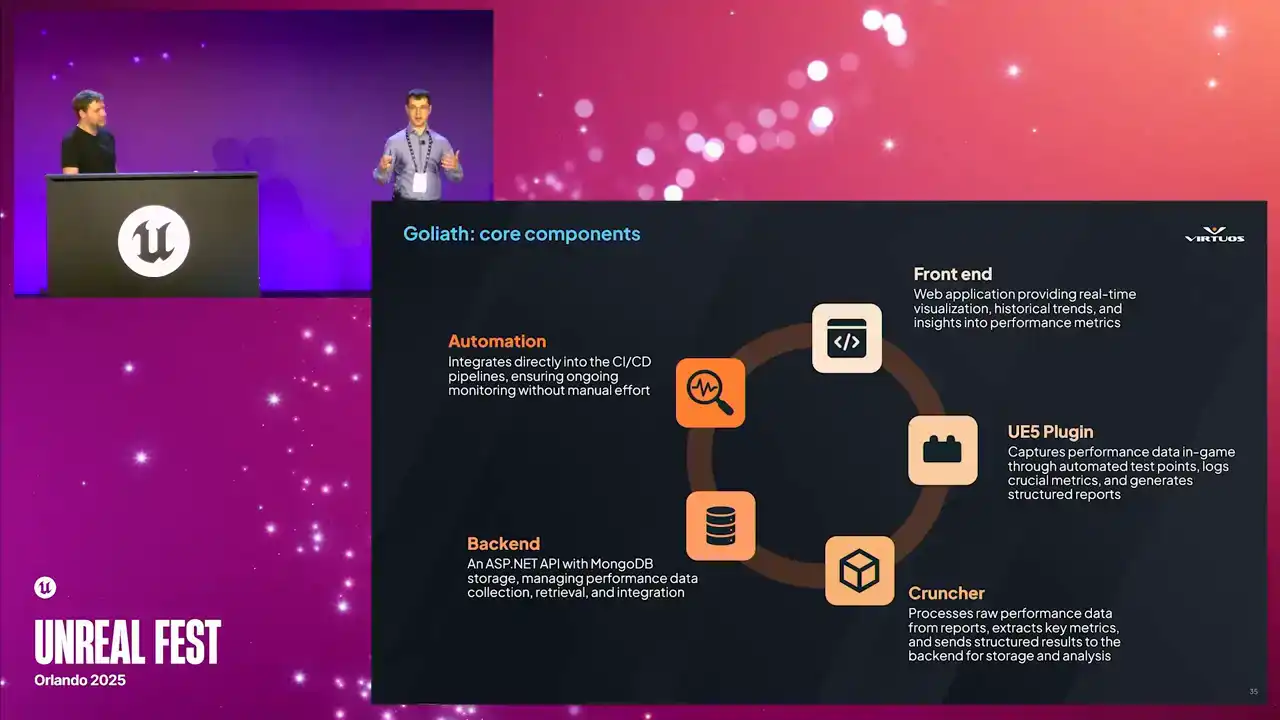
All right, so that's the idea. But what does that actually look like when when it all comes together. We wanted Goliath, which I believe we mentioned is the name of our tool, I'm not sure. We called it Goliath. We wanted Goliath to be visual, intuitive, and immediately useful,
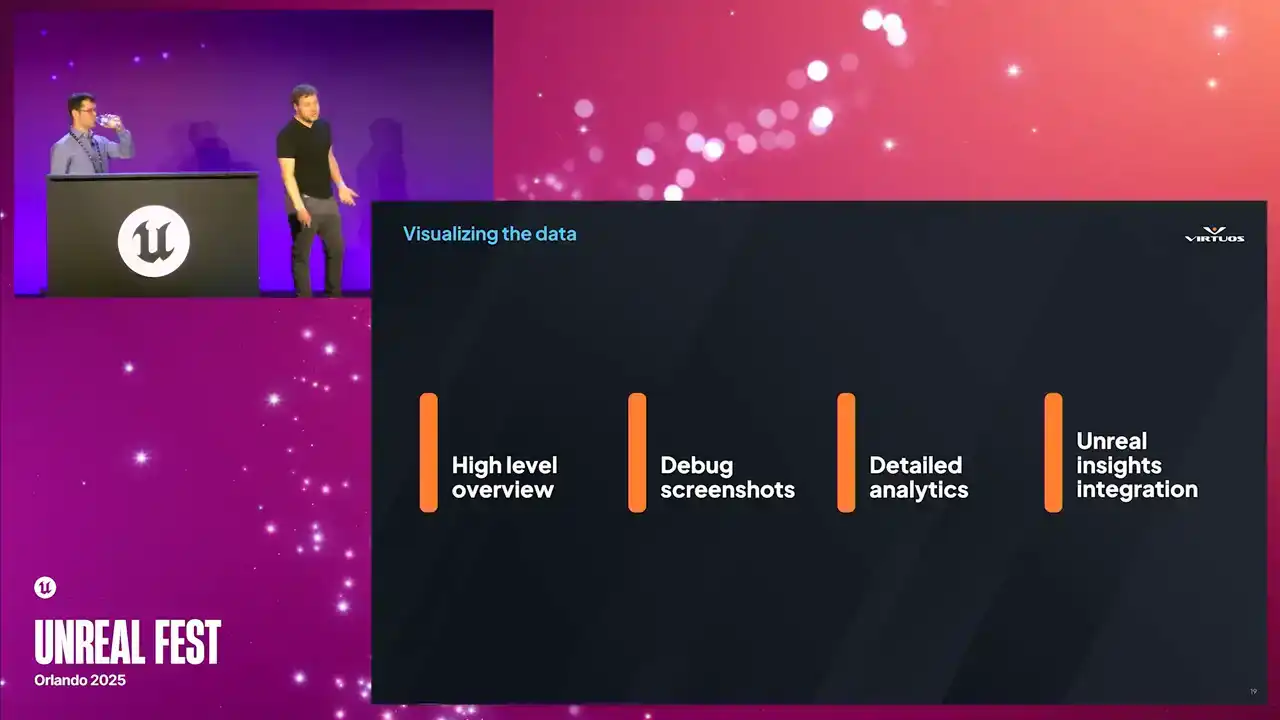
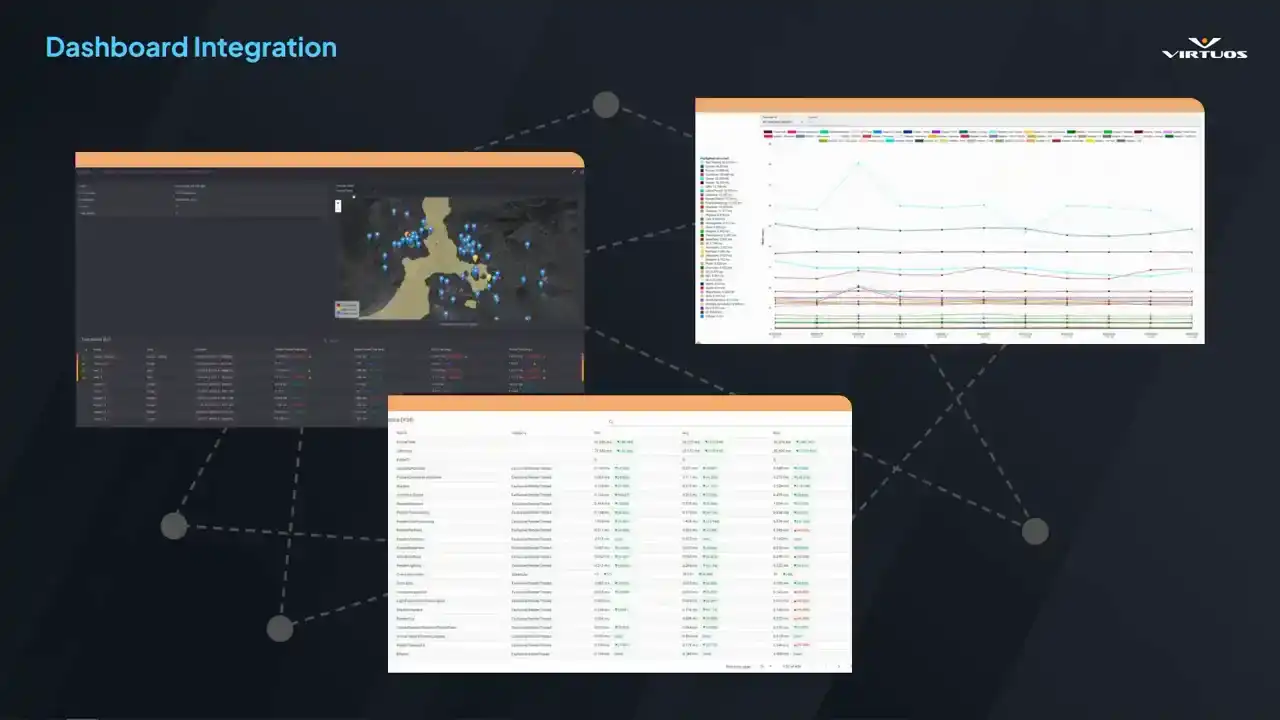
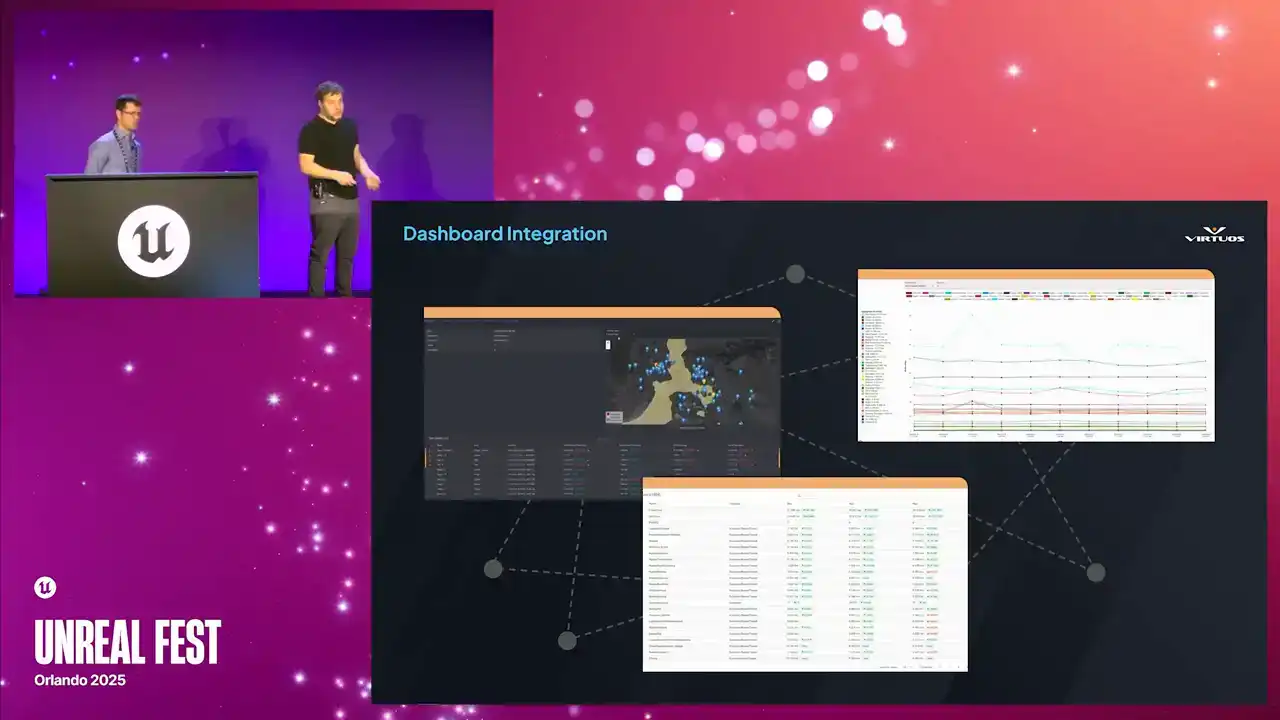
regardless of whether you're a performance engineer or a producer checking on the status of your project. The goal is simple, rich, accessible information that gives you the full picture at a glance or in depth. So let's walk through what that looks like. There we go.
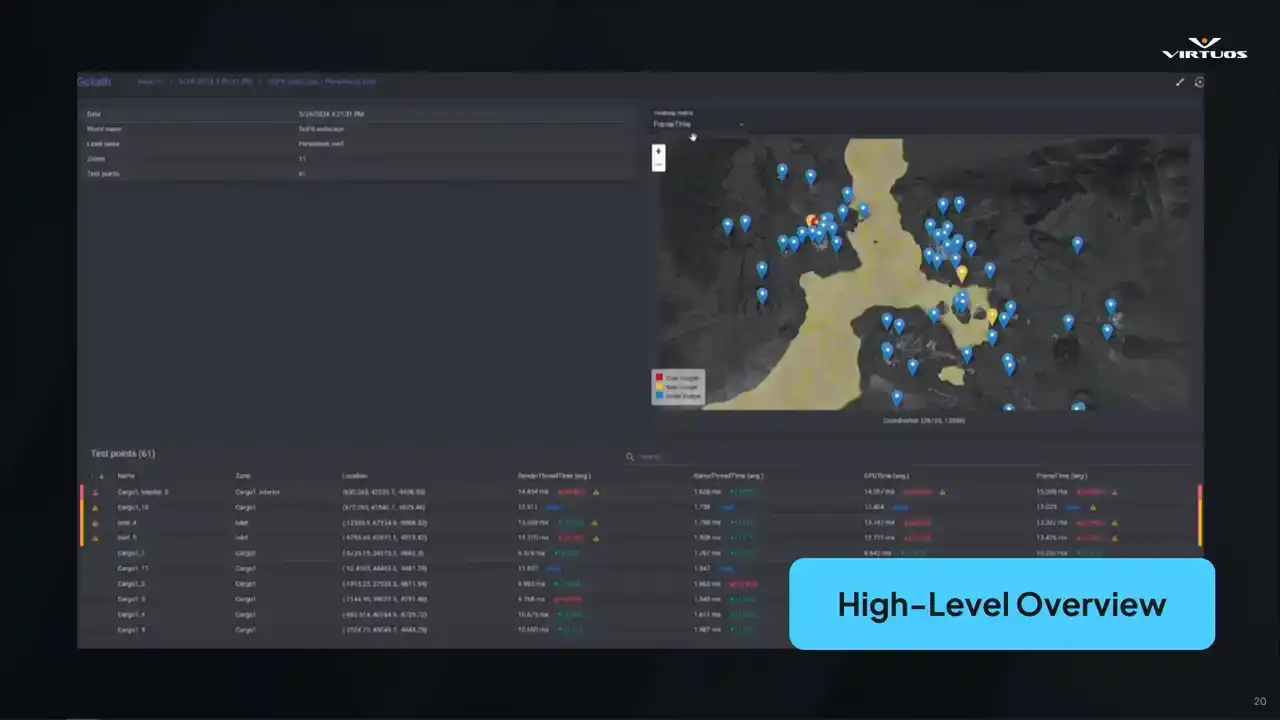
So this is our high-level overview screen. And just to clarify, this isn't a live map from Rise of Hydra. It's a generic example from Goliath. I wish I could share them with you, but we're all gonna have to wait to see the game together. Still though, the structure is the same. On the right, we've got a map of your active checkpoints. I'm gonna stop trying to do laser pointers, because I'm pressing the wrong buttons. We've got a map with all of your active checkpoints. color and for ease of use basically Blue tells you you all good yellow we getting close to our budget and red means you over and something needs to happen here It meant to give you that immediate health check of your game
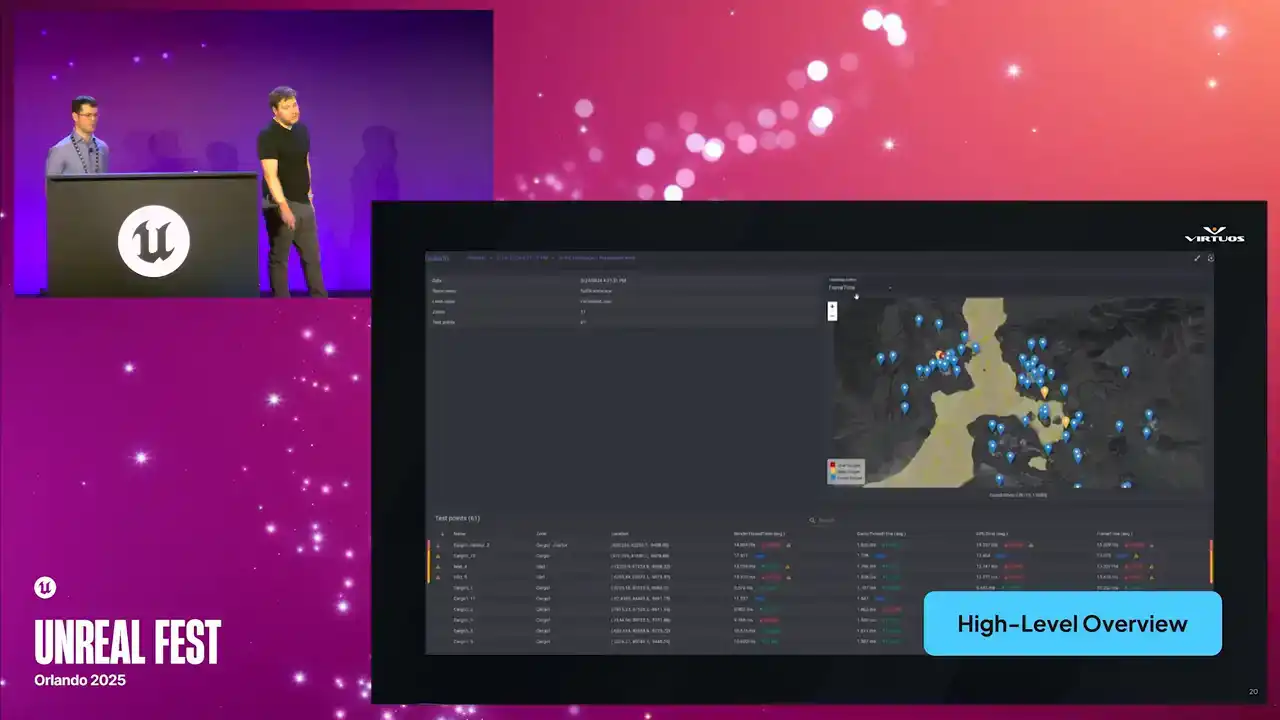
If something's gone red, you know exactly where to look. You can spot trouble across the project in seconds. Top left, we're also tracking some additional metadata from the scene, and below that, you get a breakdown of the major performance metrics. Our render, our game thread, and so on. The important thing here is that we don't need to open a profiler
or even install any custom tools. This is built in a web front end for visibility across disciplines. We can have QA jump in, leads, producers. Anyone who wants to see this, see how things are trending in the game, have access to the tool.
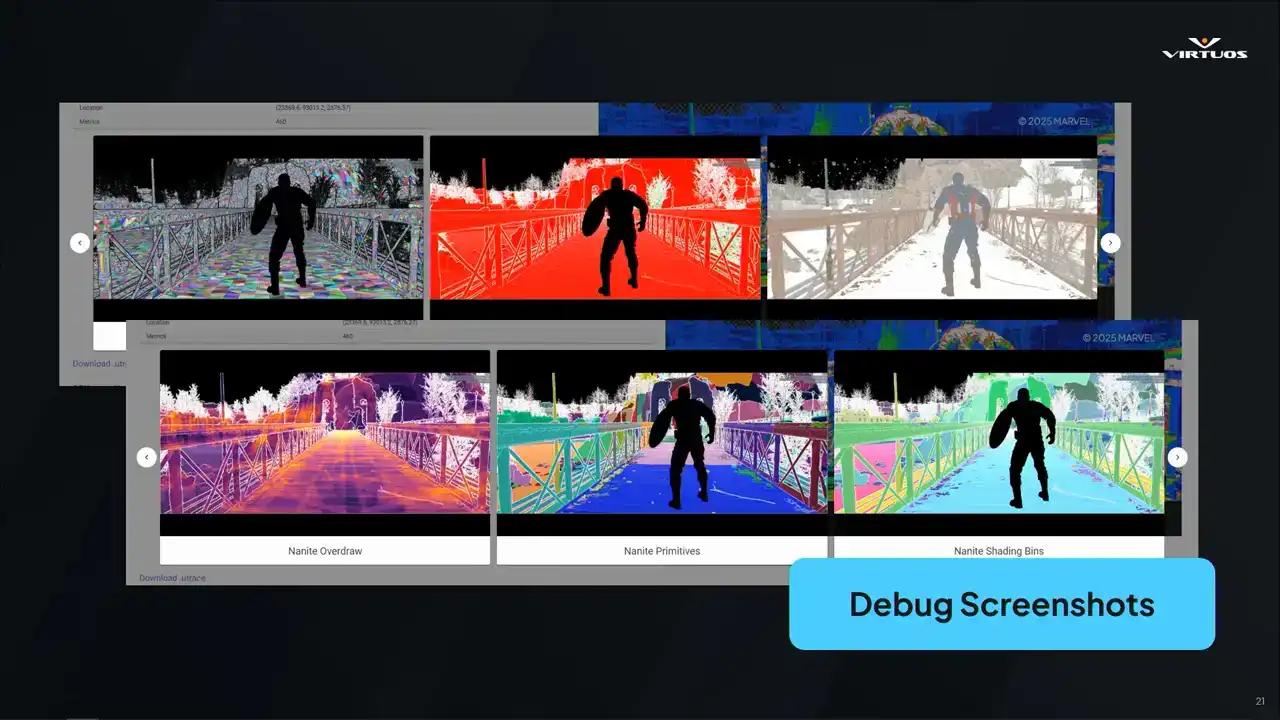
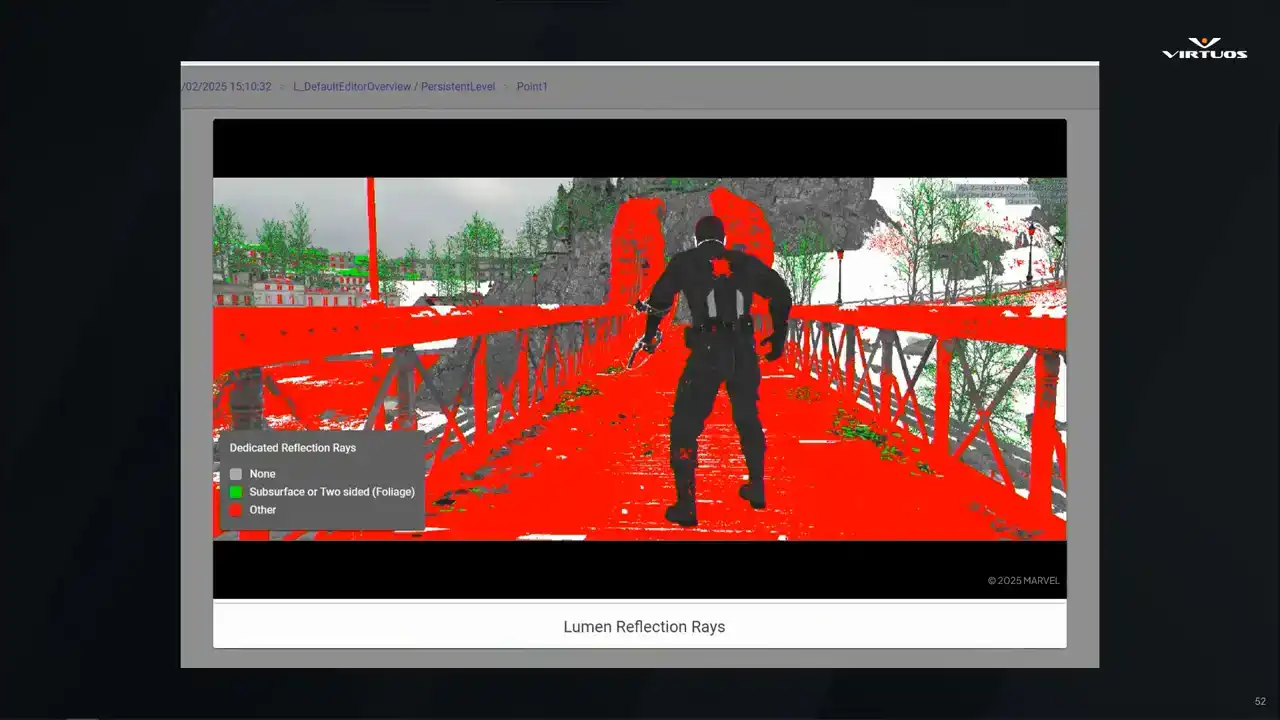
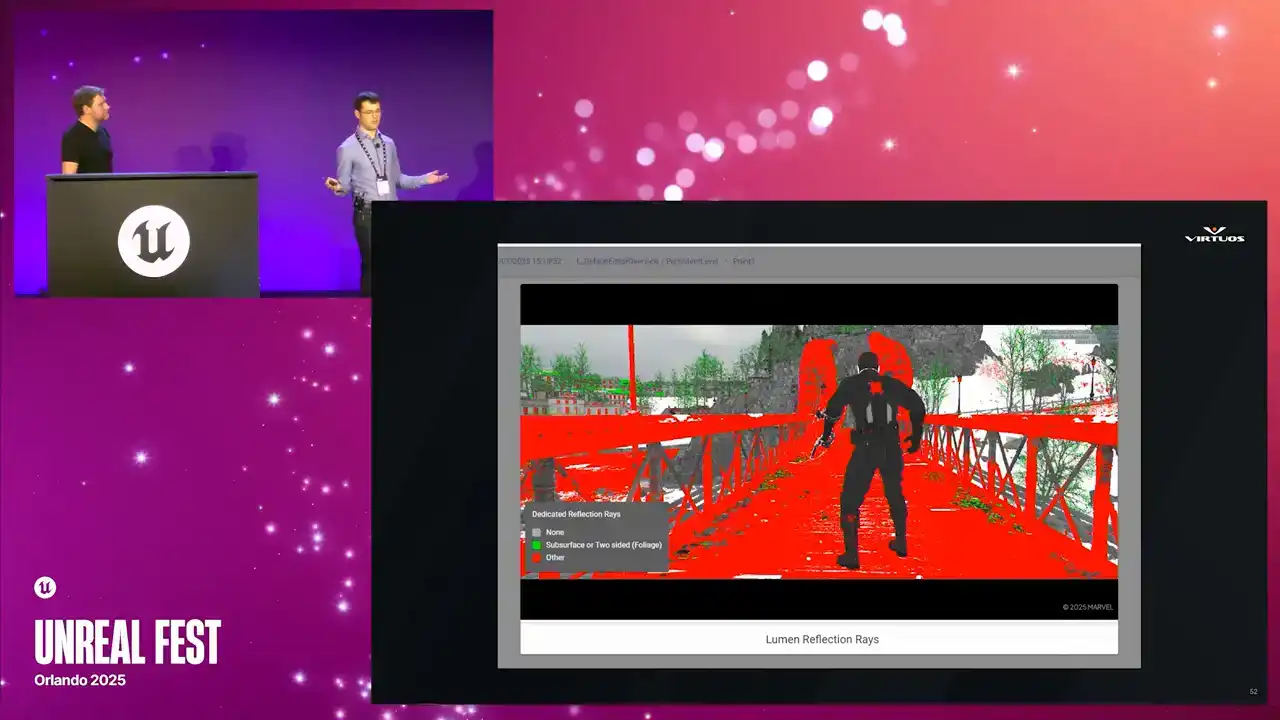
So next up, debug screenshots. Those of you who have worked in performance capture in Unreal for a while, you're probably going to recognize these. They're the standard Unreal debug views. We have our overdraw heatmaps, complexity, lighting buffers, and Golight captures them all automatically at each checkpoint.
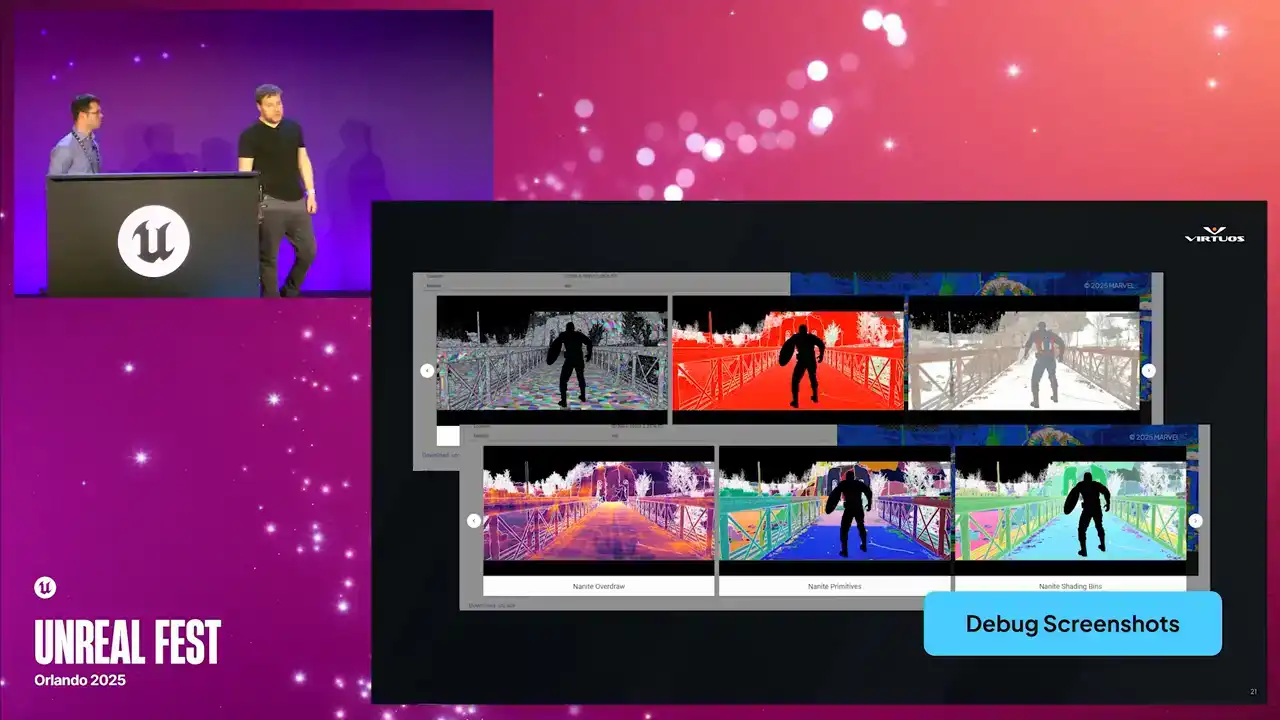
What makes this powerful in this context is that they're captured alongside all of the other data and the metrics at the checkpoint. So you're not just getting the visuals in isolation, you're seeing them in the context of the full capture point. And that correlation is what matters. When performance spikes, you can pull up the checkpoint, see here's the metric, here's the scene, and here's the visual change that we can see that caused it.
And because Goliath stores that visual history, you can track that across builds as well and compare that directly to the performance trends all in one place.
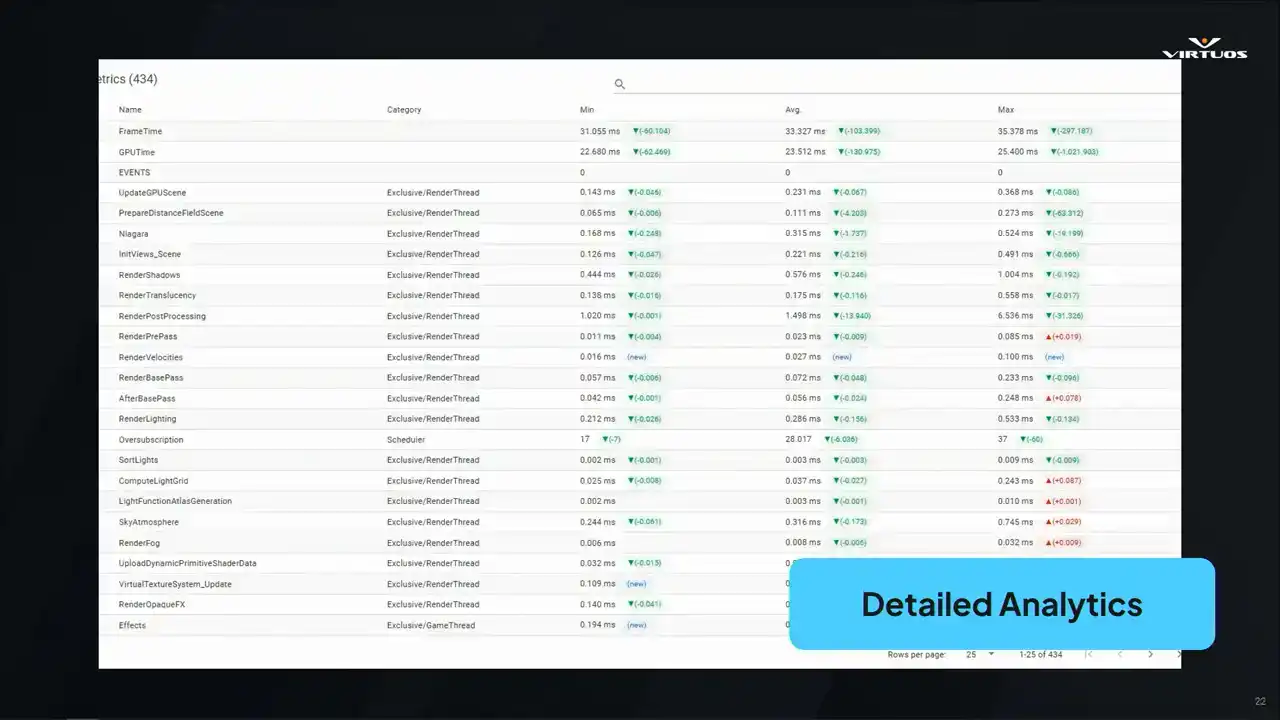
All right, so now we're getting into a little bit of the deeper analytical side of Goliath. When we started this, we started out with the basic CSV profiler data. We have our min or max or average frame times across the key threads and systems. It's simple, but effective. As a first step, it gave us a structure to see the changes that we wanted. But once we put this into production, we started to see its limitations. Ultimately, this approach didn't have the depth of data that we wanted to debug root causes and issues. And ultimately, that meant leaving the ecosystem data and breaking our one dashboard goal. That ultimately led us into the integrating insights as our first major update. We'll come back to that a little bit later.
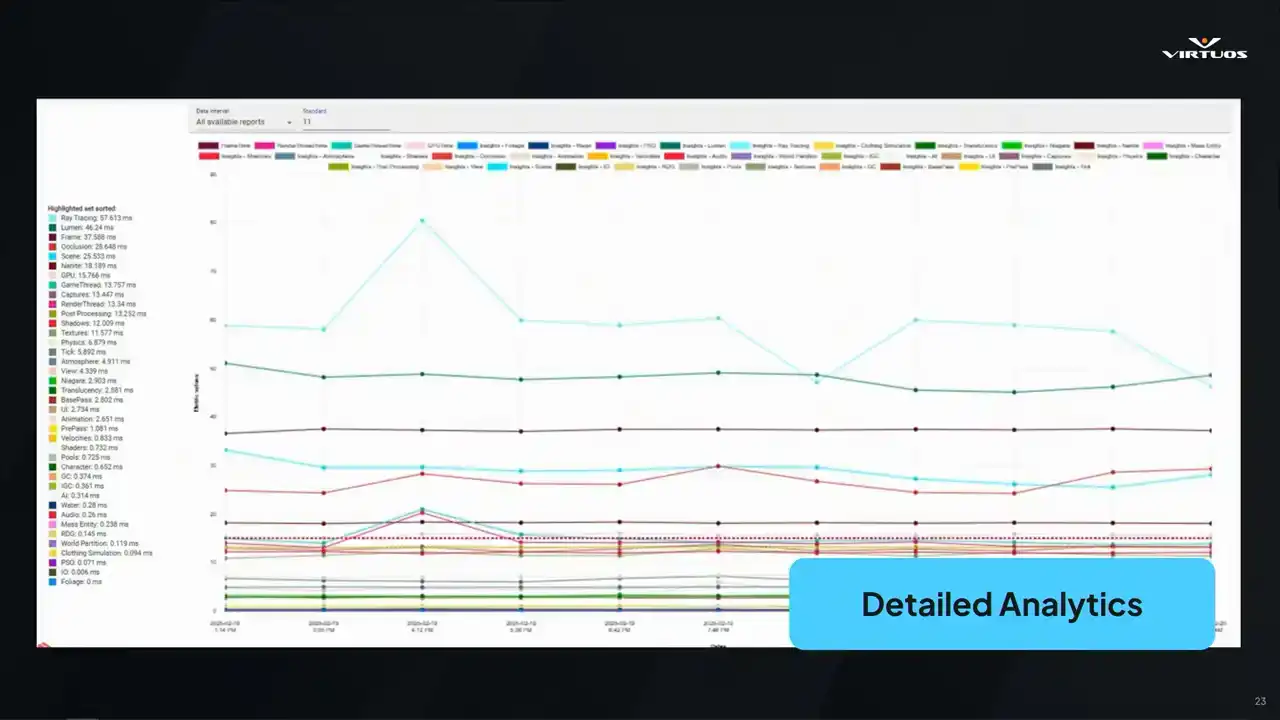
Another key requirement that Damaris mentioned is being able to track things over time. This isn't a nice-to-have, this is essential to a tool like this. Goliath plots its key metrics across builds based on the data that we're capturing from Unreal Insights and grouping it into what we call event groups. It's our own internal way of making sense of all of this huge amount of insights data,
and we'll unpack that a bit later, too. The goal really here, though, is simple, right? friends early, see exactly what the issue started, and connect those changes to the project. If performance dips, you're not guessing, you get straight to the graph, find the spike, and trace it back to the build and the system that caused it.
That kind of visibility allows you to act quickly and allows you to focus your effort where it really matters. And finally, again, we're not looking to replace existing tools.
They're great tools, we all use them. So we wanna work with them. So if you spot something suspicious in Goliath, you can jump straight into the corresponding Unreal Insights trace file. Click a button, download the Utrace, and open it in Insights. There's no guessing which trace files matched, which checkpoint, no more, you know, can someone just run a capture and hope that we get that spike?
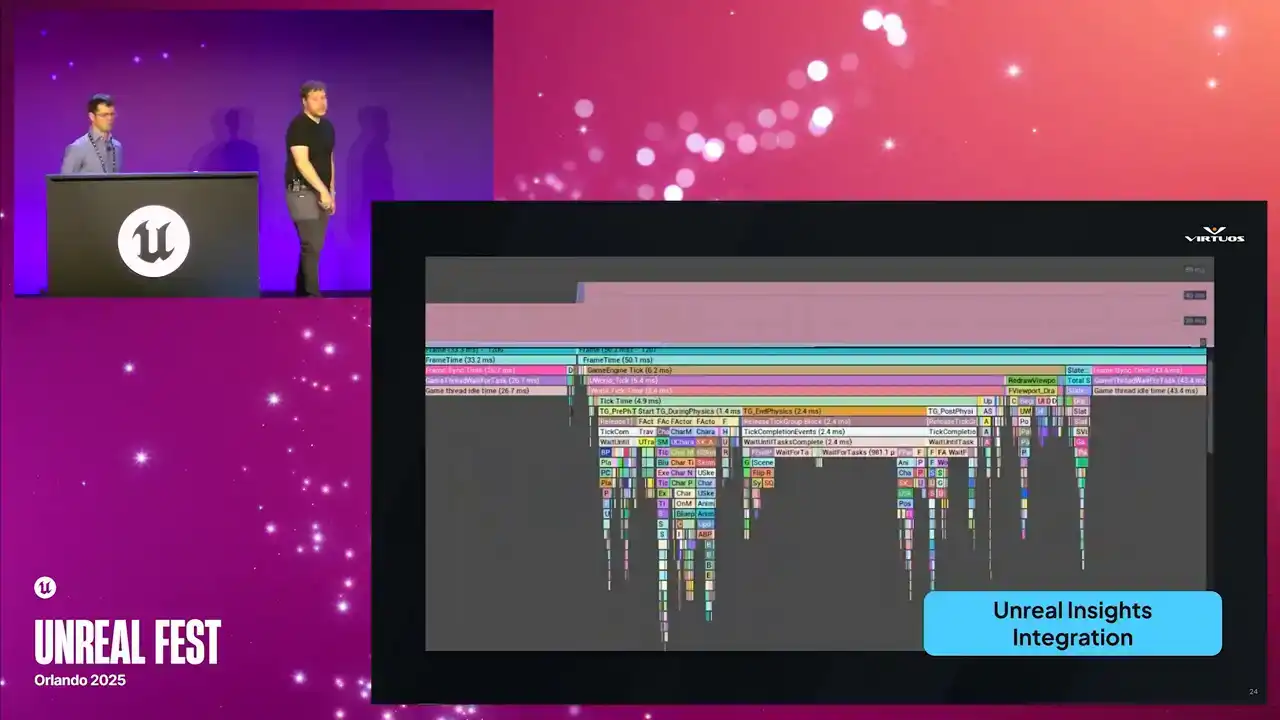
You can go directly from the red flag in the dashboard to a deep dive in Insights, Insights tooling, in Unreal Zone tooling with zero friction. And that's, again, where the real power in a system like this comes into place. You go from that high-level, clear view to low-level details, all in one integrated workflow.
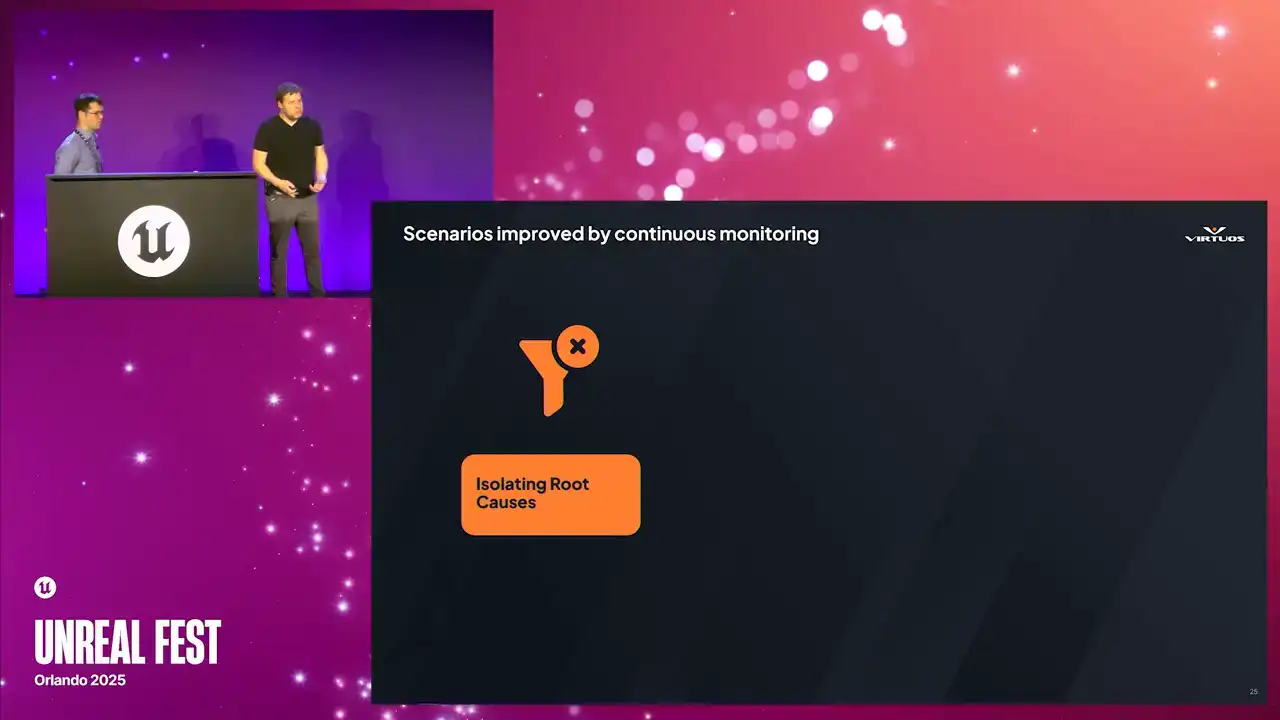
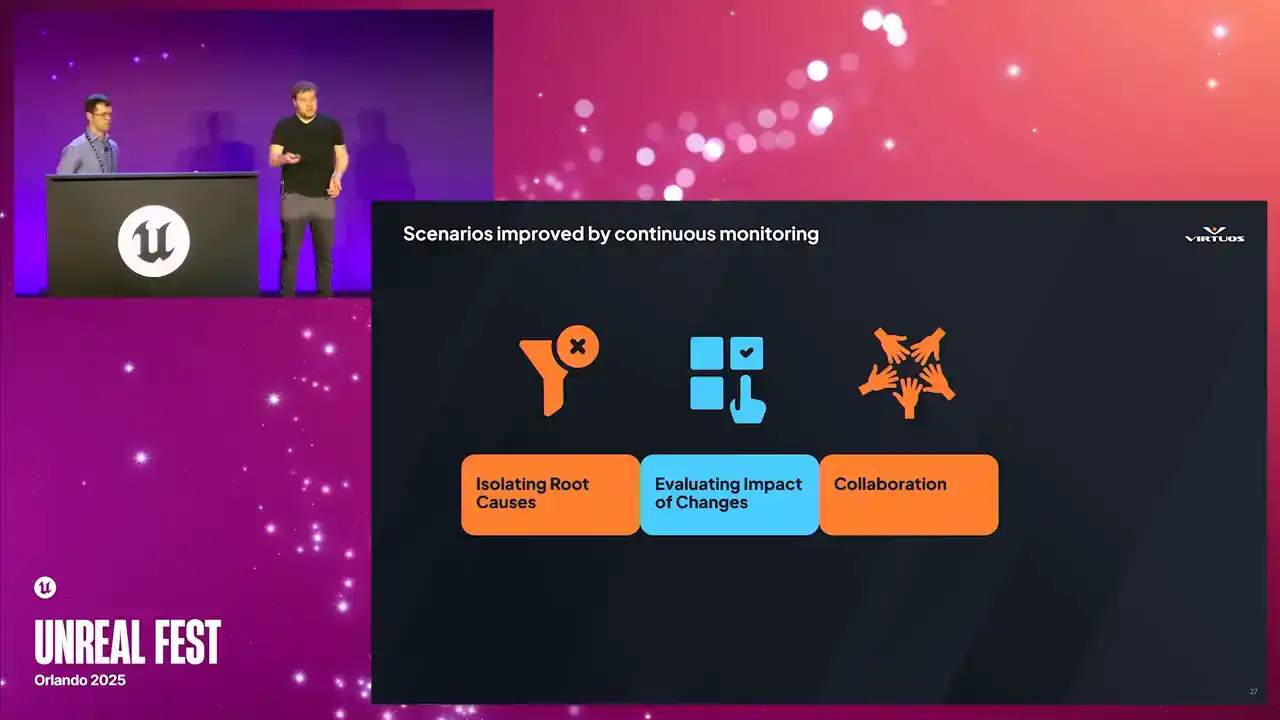
All right, so let's talk a little bit about the kind of change you get with this kind of clarity in this approach. So first up, talking about isolating root causes.
There's a really fun article that I read in PC Gamer a couple of weeks ago when we were starting to put this together. One of the Skyrim devs, because they have loads of freedom and got to do cool things, decided he wanted ants in the game at a certain point in the map. I think that's a cool level of depth to be able to add to a game, right? It's a nice feature and a fun part of the map. Except each ant cast its own shadows. So as you can imagine, performance took a little bit of a dive in those areas where that was running. And this scenario without this kind of a structured tracking is that these kind of changes can go unnoticed for days, weeks, potentially. And by the time someone's investigating, all that context is lost and you're starting from zero. So now picture the scenario with Goliath running.

A checkpoint in that area catches the change after the answer added. Next morning, you see a red flag, check the data, you go to a relatively short list of changes, and see if someone's been working on ads. Check it out and you solve the problem. That feedback loop is closed in a day, not a week or a month.
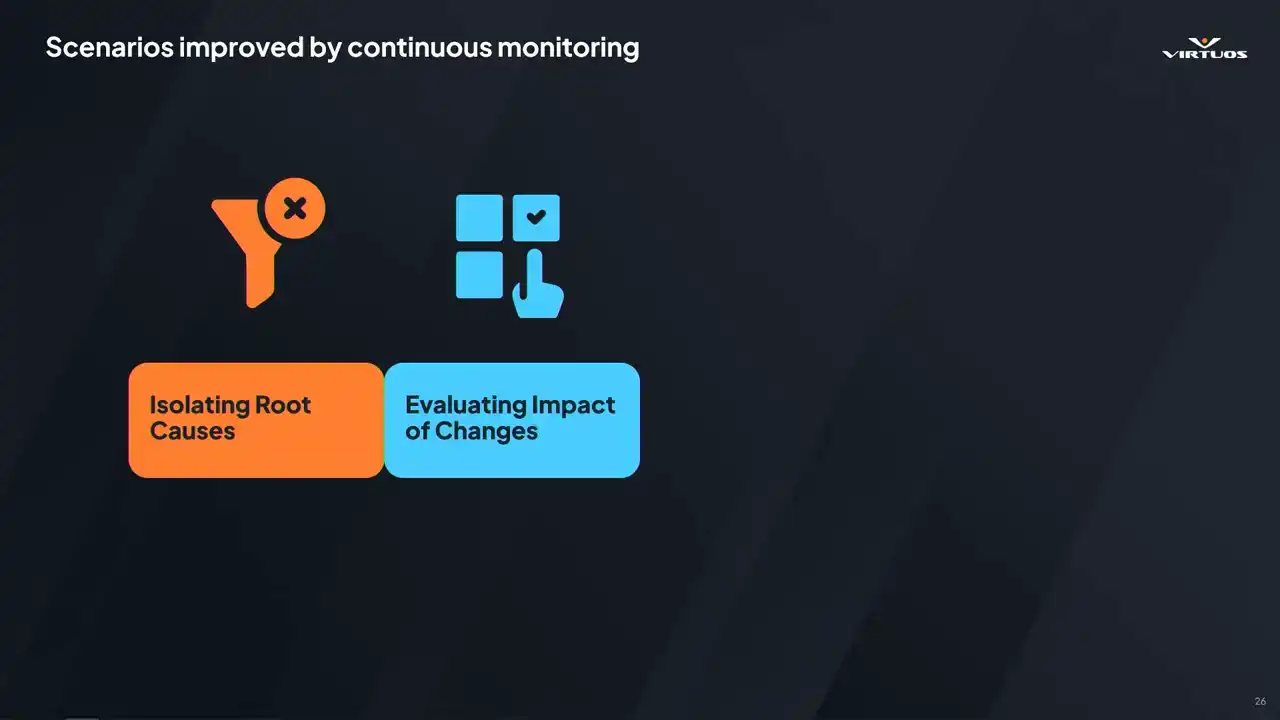
Second benefit is evaluating the impact of your own work. Developers want to focus on building features, They don't really want to be worrying constantly about performance, especially in those early stages of feature development. So we make it easy. You check in your code. Goliath picks up the next automation run.
And when the data's in, you take a quick glance at the dashboard. Did the frame time explode? No. Great. You can move on with your day. It's a small change in your workflow, but it is powerful. It removes that friction to understanding performance, and it brings that awareness into a natural, low-effort part of your daily workflow. And when you do check in something expensive, you fix it early before it snowballs into a late-stage risky optimization problem.
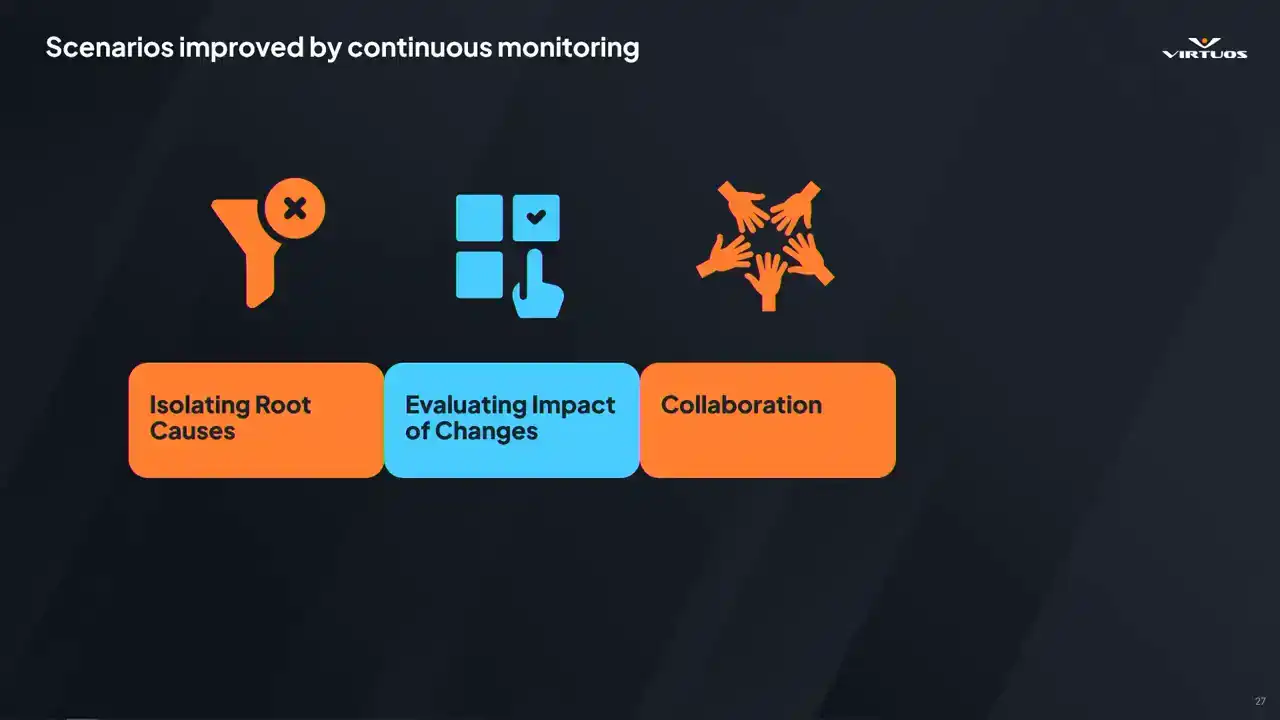
What we've also found is that collaboration improves dramatically when everyone is working from the same data point. Instead of something vague like saying, well, something feels a bit slow today, You know, lead can say that checkpoint turned red. You know, can you take a look? It's direct and actionable and it saves time.
And once the team sees the value in that and they start engaging, you know, QA flags an issue. Designers have a way to share their concerns. Engineers have threads to pull on and explore. The whole team rallies around that shared data instead of assumptions and blame and all of the other negative things that come along with this. It's not just delegation, it's a better conversation,
it's better decisions and a smoother path to fixing those problems together. And finally, there comes tracking all that weird stuff that just happens in the game sometimes.
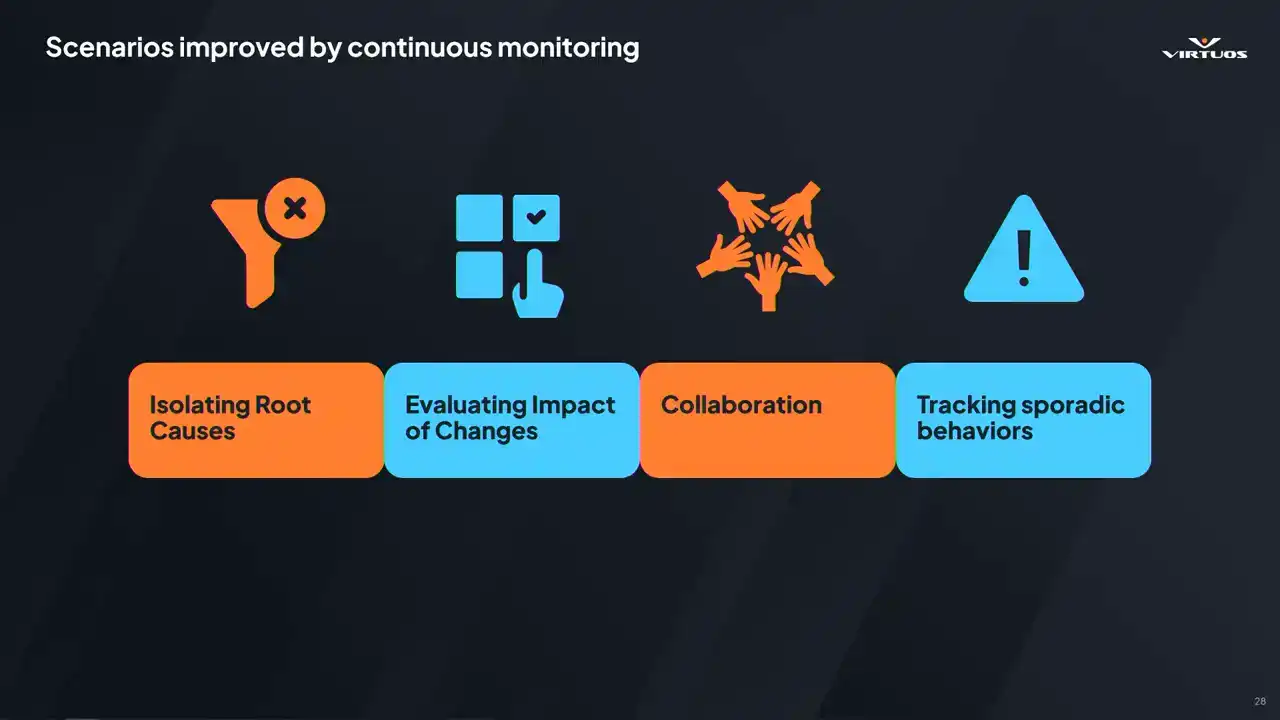
Some issues, they just show up occasionally. A hitch here or a spike there. Manual testing might miss it, might treat it as a once off, or potentially worse, you might overreact to a fluke based on limited testing data. When you're capturing this data consistently,
and those patterns become visible, you see exactly when the sporadic behavior started, how often it happens, and whether it's getting worse. It helps us separate those real problems from the noise, and it helps you understand and identify the nature of the systemic issues.

When it comes to building Goliath,
We made it to be modular and even engine agnostic. There are some standard components that can be swapped out as needed as it evolves, as you test the limits of the system. And this is our rationale. Your mileage may vary. It really depends on what project you're trying to build and what are your goals. All righty. Let's kick off with the front end.
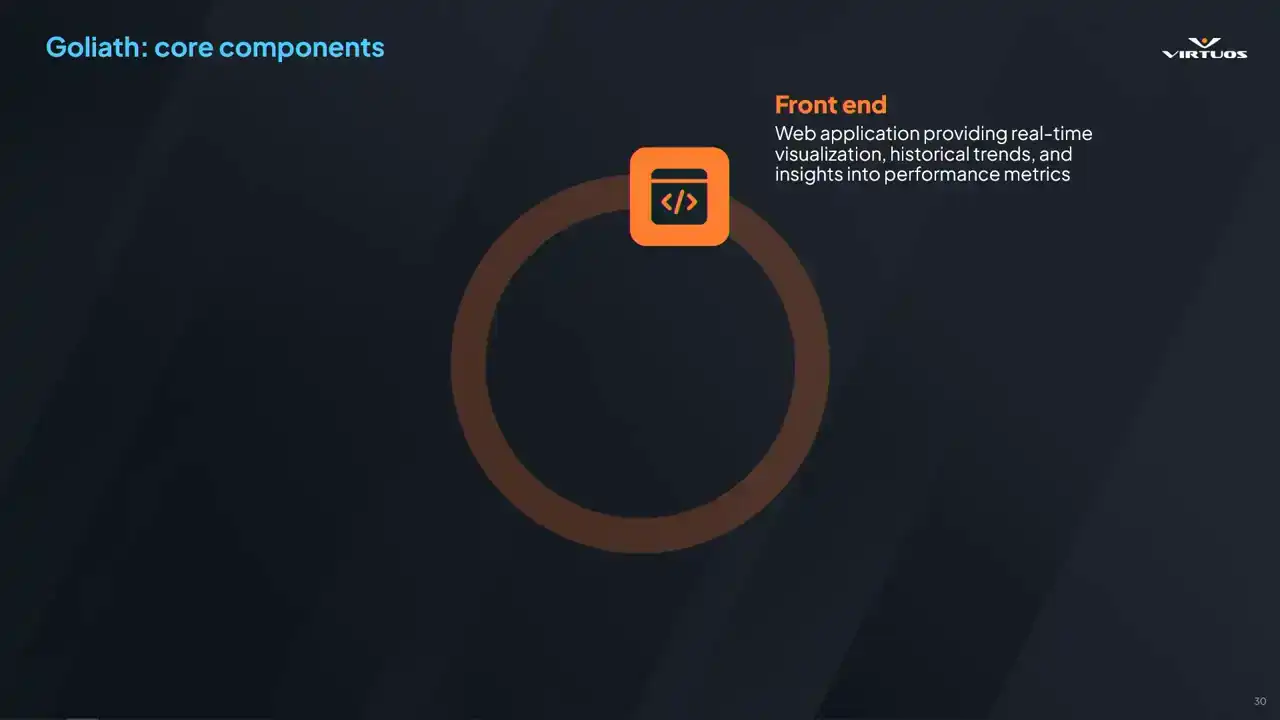
So it's a web-based application for accessibility based on Blazor. There's no installation or version syncing required. You can have your standard security. IT will be happy. And it's a flexible tech stack.
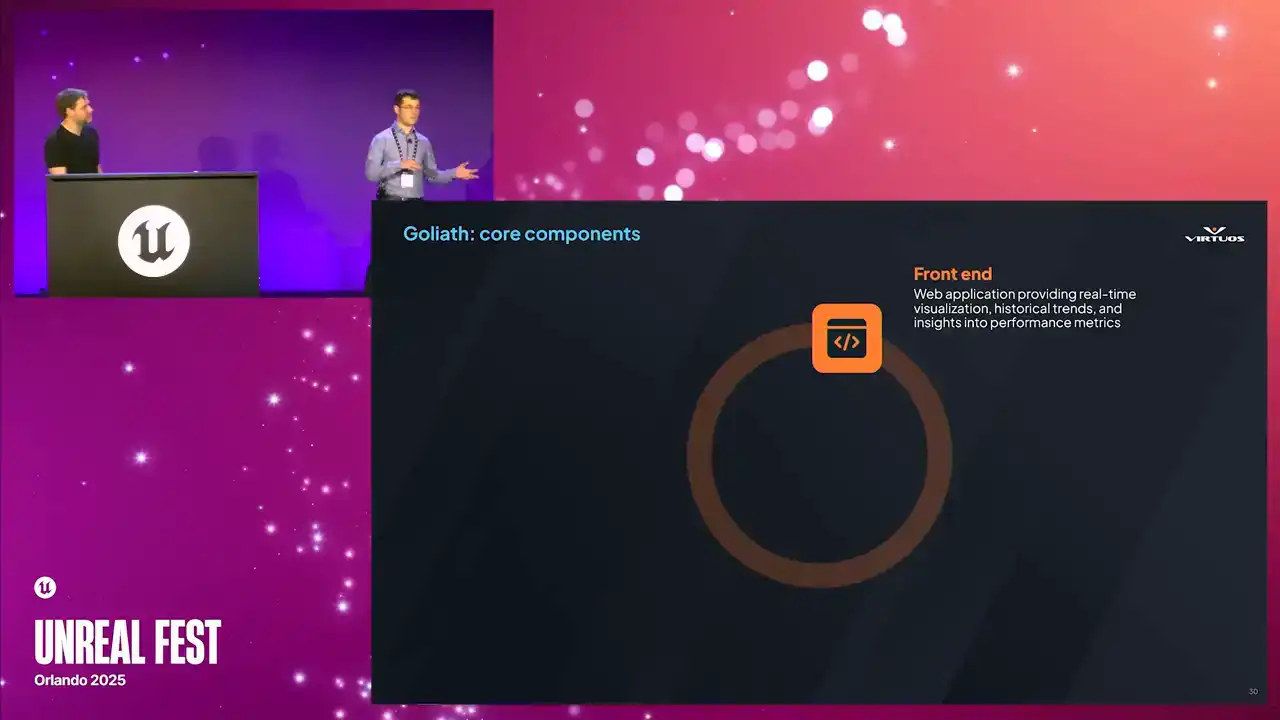
As we've made Goliath more robust over time, we really started to reach the limits of the frontend that we chose. However, since we took this modular approach, we can move it over to another frontend as needed, such as Grafana. Then there's the UE5 plugin. This is what's used to collect the data by automatically capturing the performance metrics.
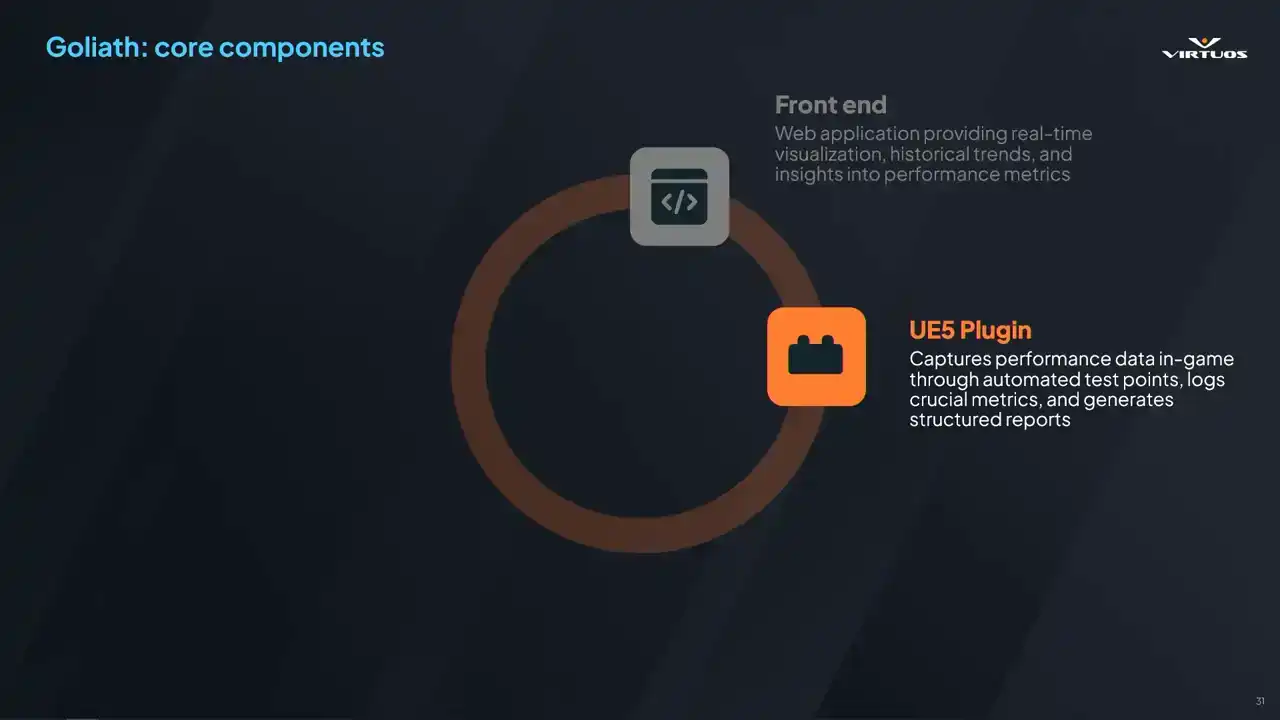
Developers can place the test points, and then they can capture those static scenes or those gyms or action sequences, whatever you want. Cinematics, VFX, it's all up there. The biggest advantage of the plugin is that it requires no modification to game assets, and all test points are processed automatically.
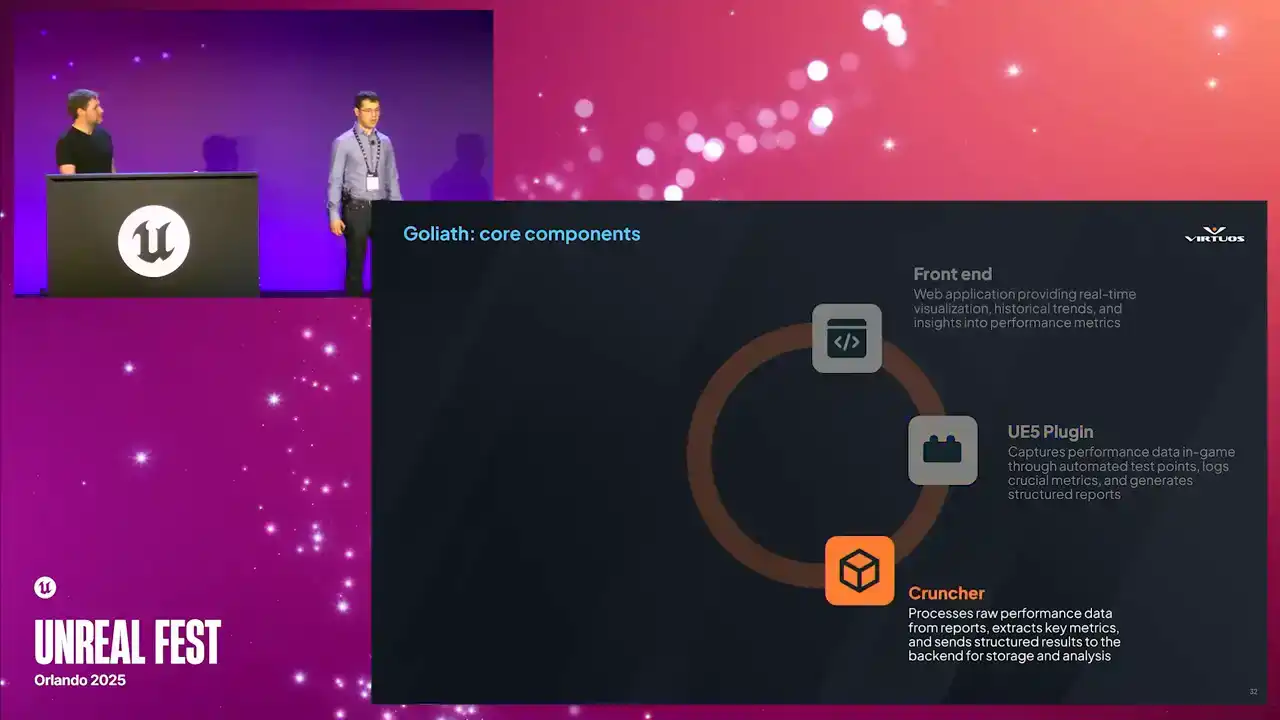
Then we've got the cruncher. This is the bridge between the Unreal Engine ecosystem and the external processes. It takes the raw captures of data and turns it into structured data.
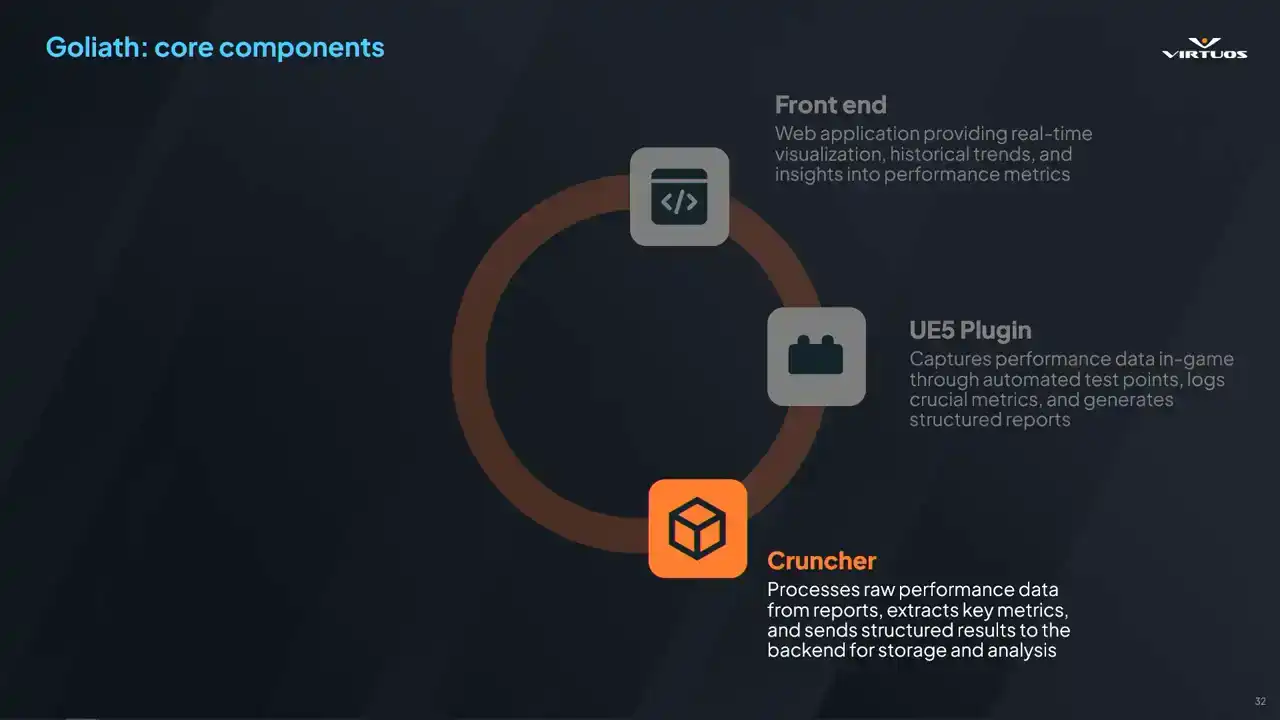
This is a C-sharp standalone executable that automatically organizes key metrics such as the frame time fluctuations, memory usage trends, rendering performance bottlenecks, et cetera. It ensures that performance data is quickly processed
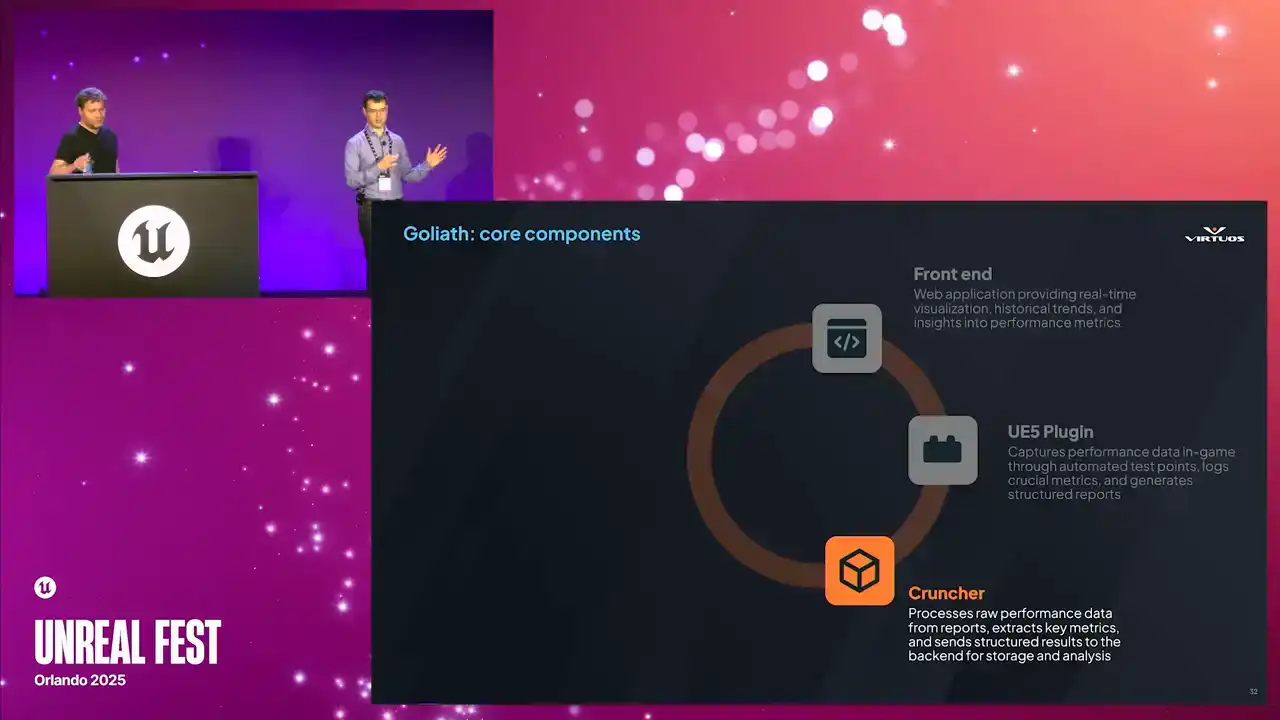
and ready for visualization in the front end. And really, once a new build is deployed, the cruncher processes all the test points and updates the dashboard, really allowing for near real-time visibility of performance bottlenecks. Again, there's no more need for constant manual profiling. Then we've got the backend.
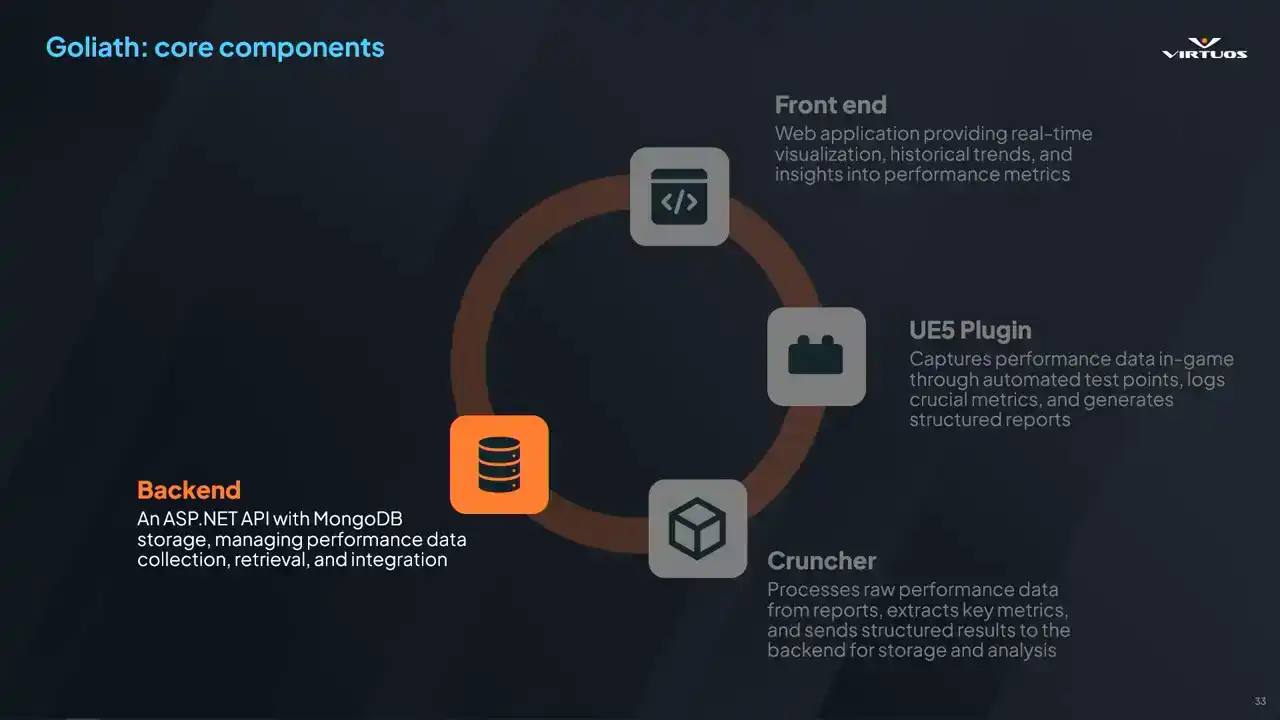
So this is responsible for managing all of the data that's been captured. It's built on ASP.NET, utilizes MongoDB, and ensures structured and efficient storage of all collected data. You can build it how you want to. Its key responsibilities are handling the API request from the plugin,
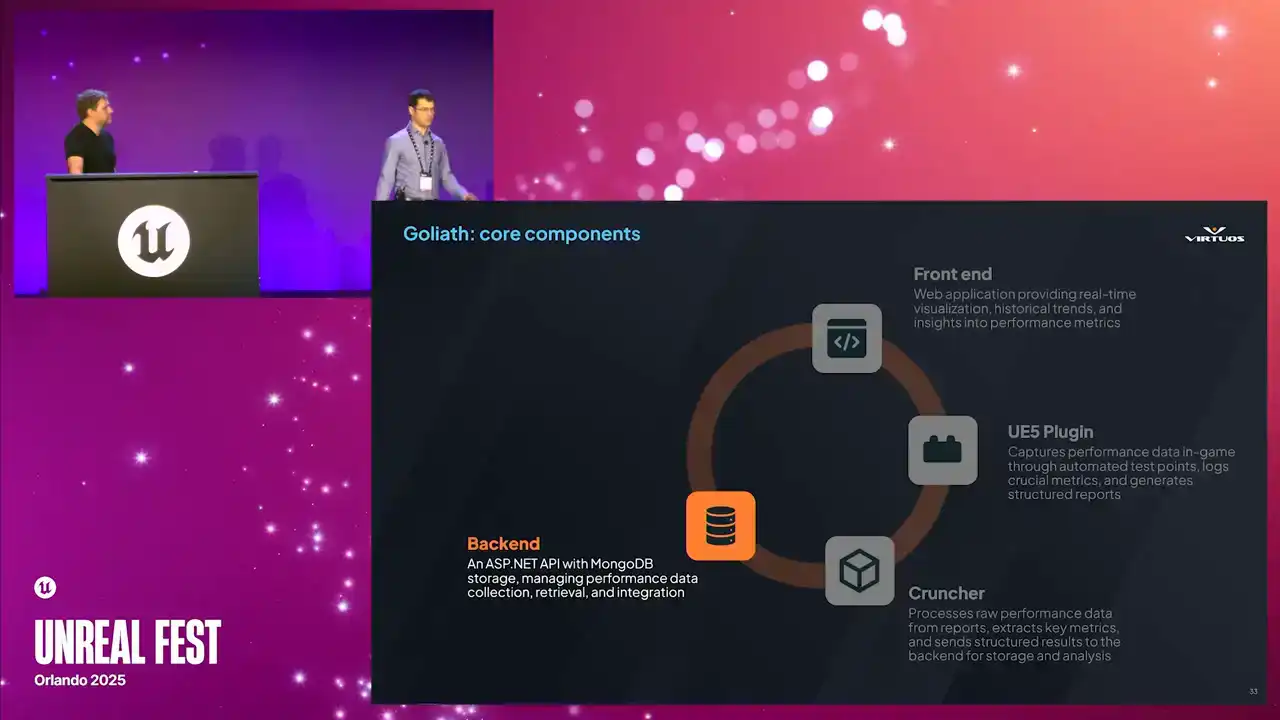
and the crunch or the front end, storing the performance data, ensuring that teams can retrieve and compare those historical records, and then providing fast, real-time access to key performance insights. It scales to multiple SKUs. I mean, we can even capture Pi if we want. MongoDB is flexible. It's a flexible data storage, and it has a high query speed.
There is a restriction, though. This space grows quickly with raw data. Insights has proven that at 100 megabytes or more a capturer, we start quickly running into data problems. I mean, you've got 10 test points, 100, or even thousands, if you've got an open world. This is a problem that we're actively looking into.
Once again, automation. Consistency matters. Every day, get a new change list. This can be integrated into any CICD system you have So we decided to use a Jenkins pipeline but honestly just use whatever you have in So this is a framework that allows us to innovate on, and it allows us to look at performance in an integrated way. And we're looking at things from a new perspective. So really, myself, I love sitting in a meeting room
and hearing that aha moment or those discussions. oh hey, okay, there's a problem here, but we solved it because we did this and this. We figured it out in an easier way to think about the problem. All right, this is great. Are we done here? The system's perfect, right? Smooth sailing, of course not. Let's take a step back. All right, we started first with the CSV profiler,
then we integrated Insights Captors. So, Steven, over to you. Cool. So, we had Goliath up and running in production. It was doing its job. It was capturing data, showing us trends, surfacing problems.
But like any good tool, as Marius said, it wasn't done. This stuff evolves, and especially when we put it into the production environment. Essentially, basic profiling really wasn't enough. CSV data gave us a high-level overview,
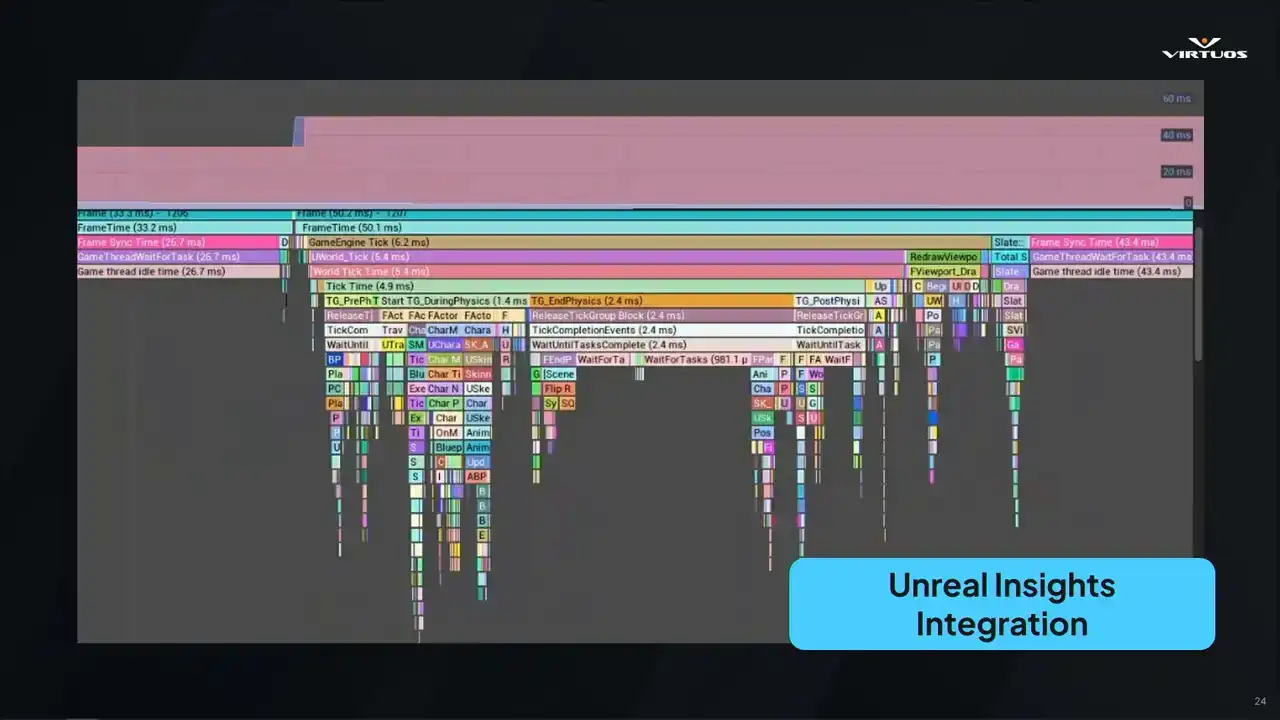
but not the depth we needed to solve those more complex issues. So we leveled up our tool. We brought Unreal Insights into the mix. I want to share a little bit of detail about that journey.
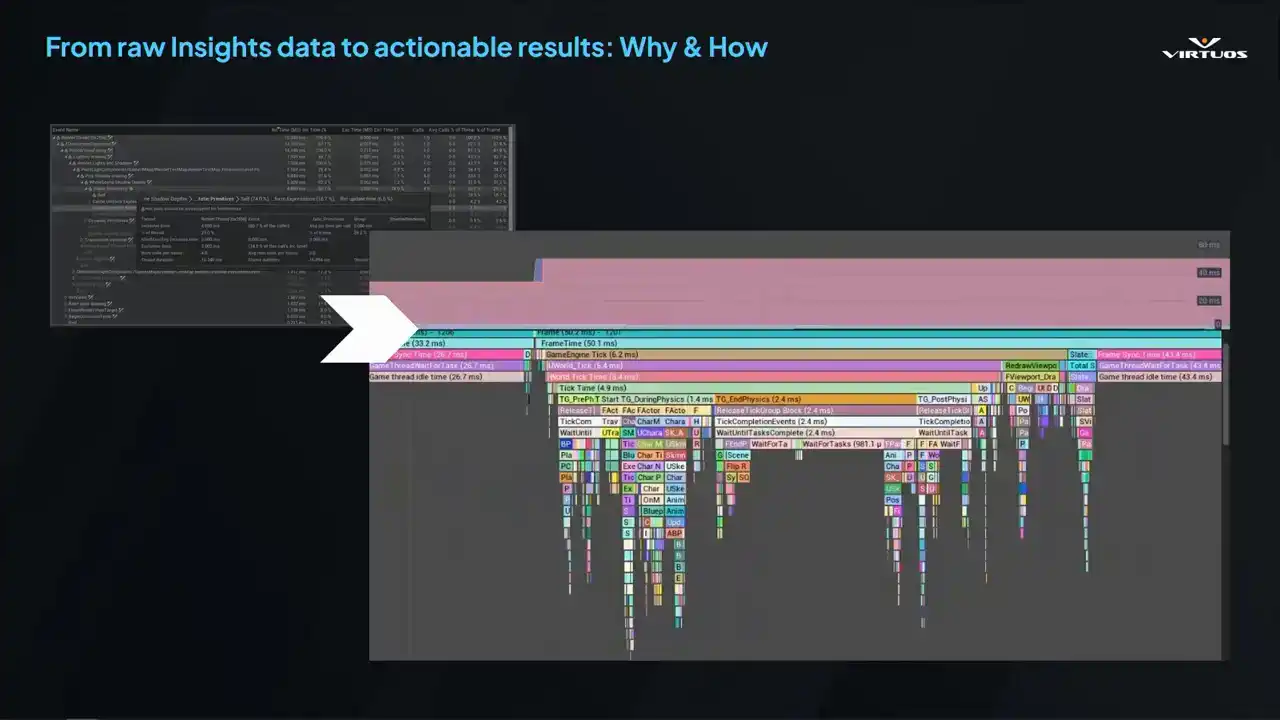
Starting with CSV Profiler here, it was quick and easy, but it was shallow. It tells you when something's wrong, but not specifically what. We needed more, and we needed a way to connect those high-level trends to detailed frame-level analysis. And so that's what Unreal Insights excels at, right? It gives full visibility into your system's timing.
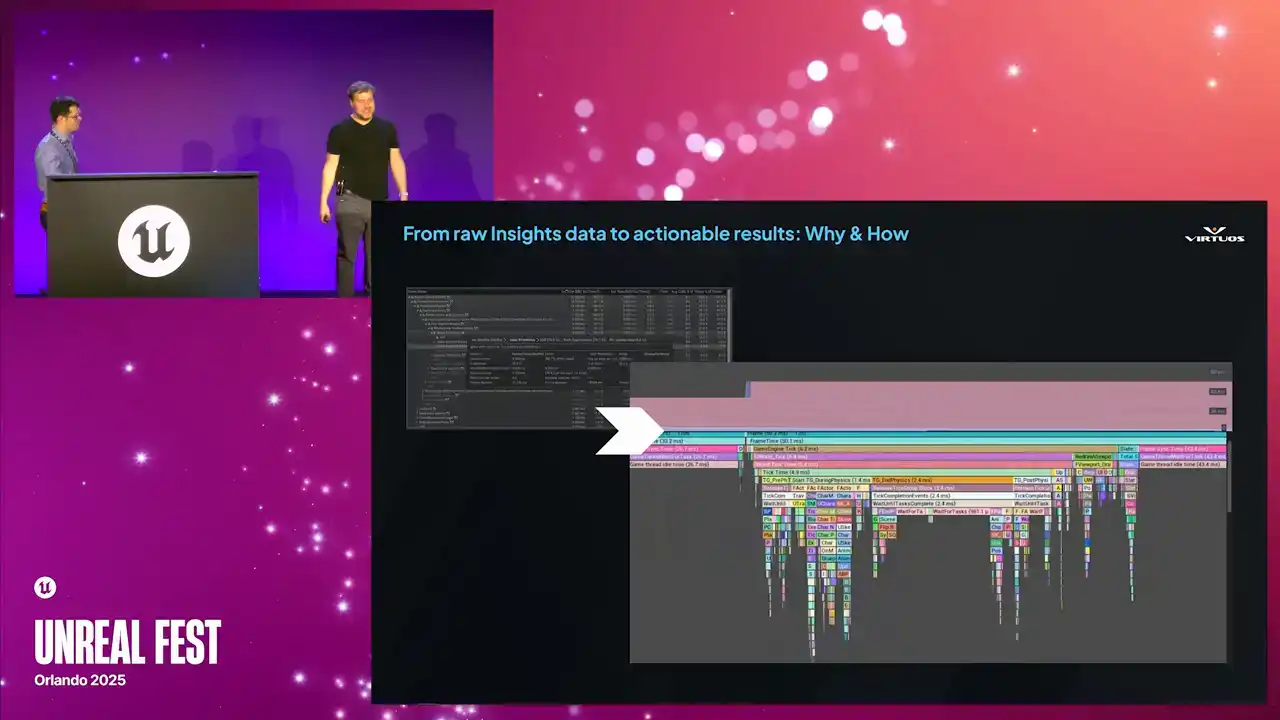
Exactly what you need when performance isn't strictly going as you want, and those tricky debug problems start popping up. But the catch, it's not really built for automation. It's tied to the editor. The data files get massive rather quickly. And getting it into Goliath took a bit of work,
but really it did unlock everything that followed. Made the tool a better place. So to start off, we really needed to understand
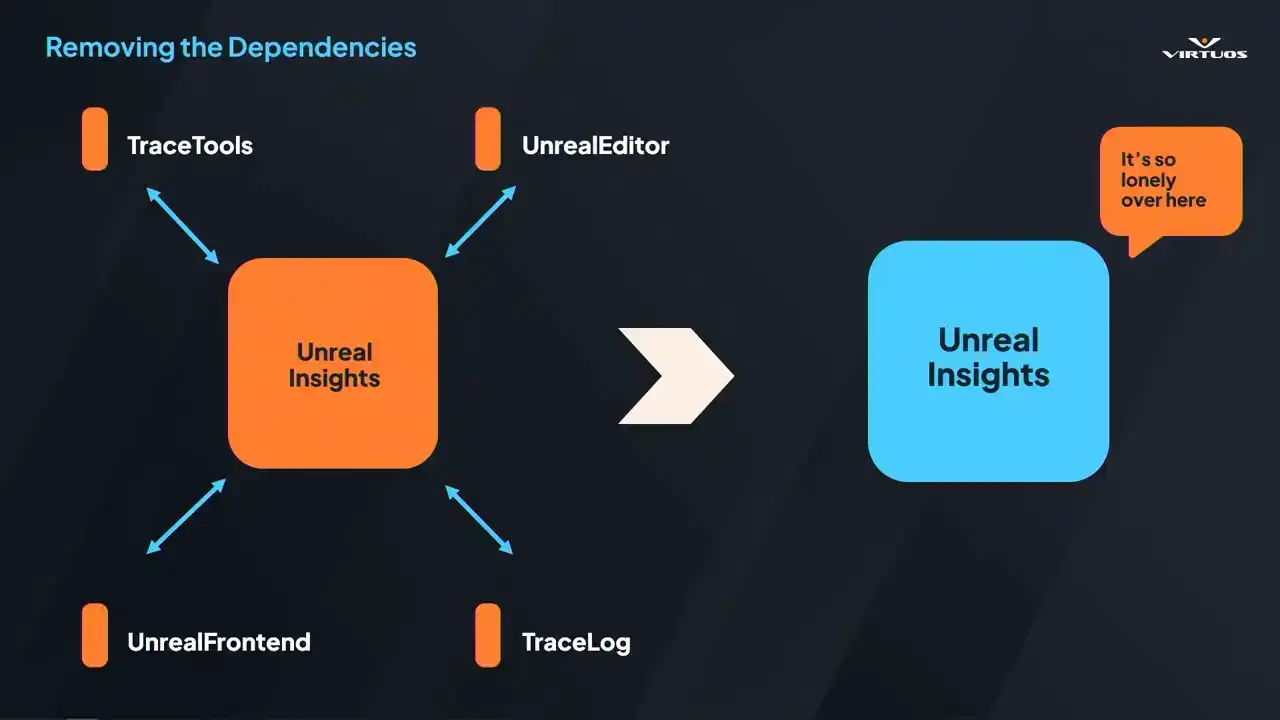
how we could run Unreal Insights in the automated pipeline. Insights being tied to the editor. It's great for local debugging, but not so good for headless automated environment. Our goal here was really to peel away all those external dependencies and produce that standalone executable that Goliath could call directly.
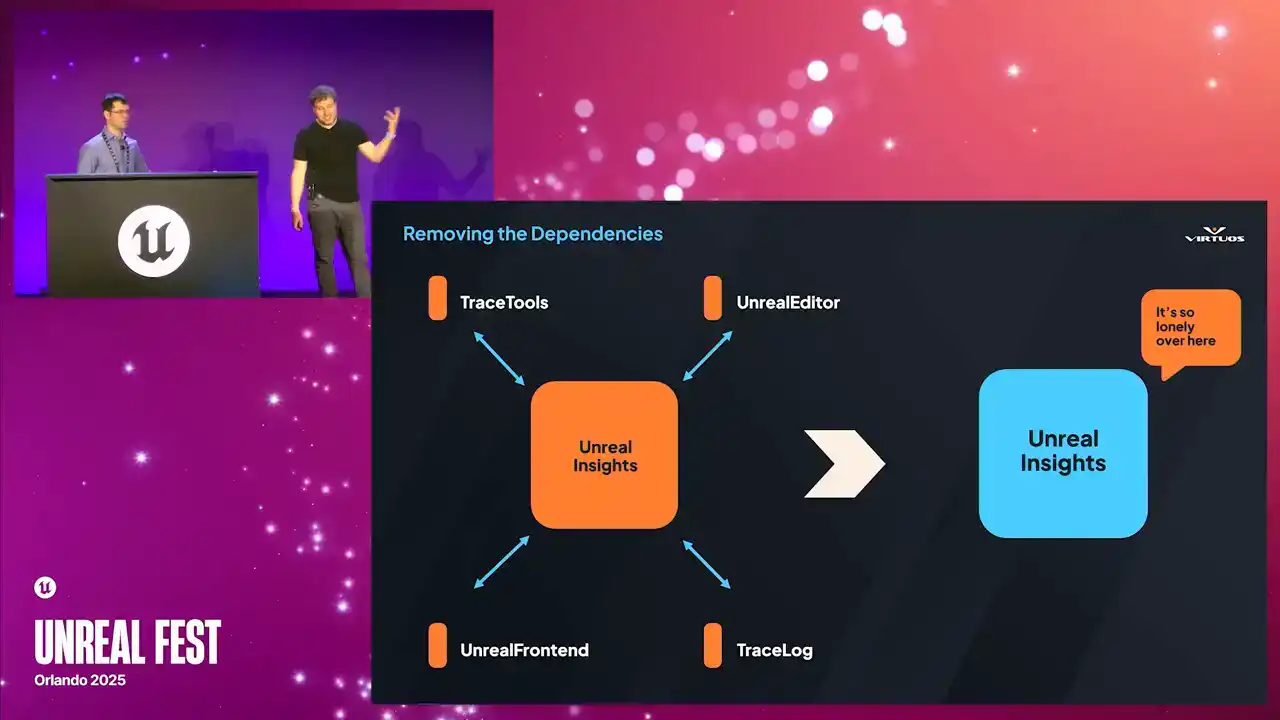
That meant diving into all of the Unreal builds, digging through code, and removing everything that just wasn't strictly necessary, so we had a command line trace analysis tool. Ensuring we could run that on the server without the full editor. And why does it matter? Because without that executable, we simply can't run it on a CFCD pipeline. So here's how that works.
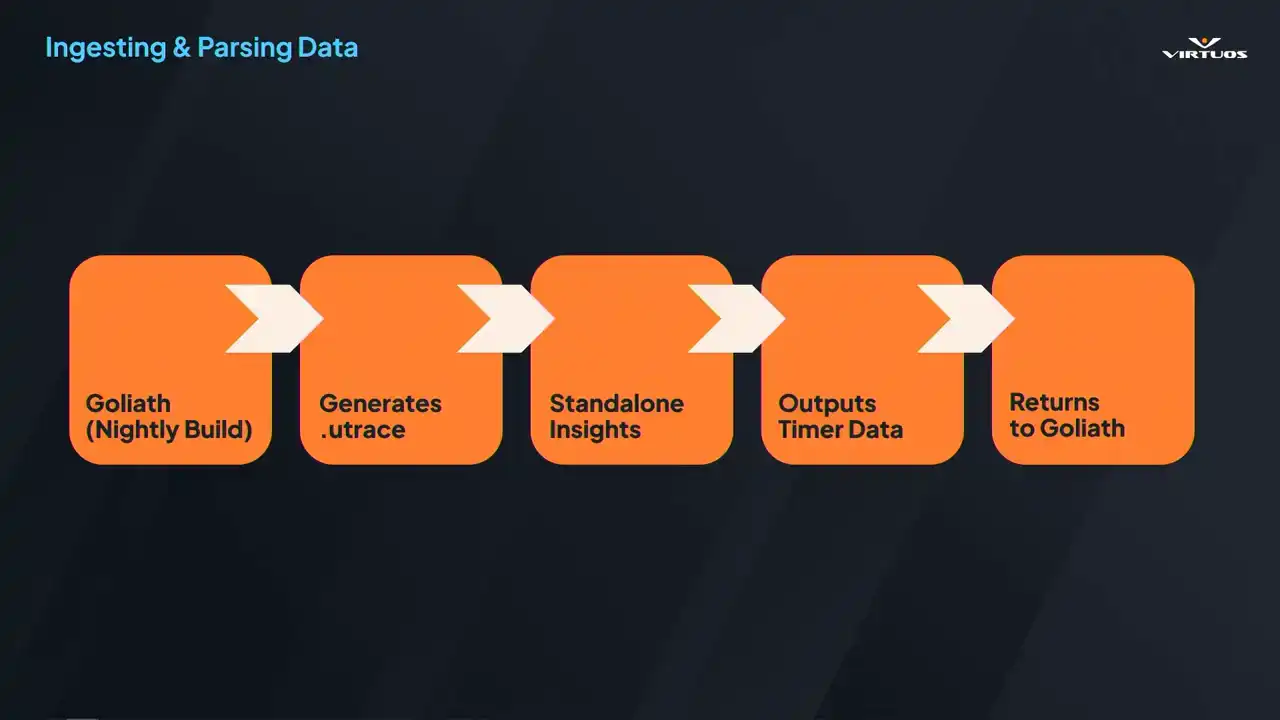
We extracted all of those dependencies that we could. We now run our nightly builds. Goliath captures those performance checkpoints across the game that we've established in our playlists. It generates Utrace files for each of those. And that file can be handed over to our custom insights processor. It spins up, parses all of those traces,
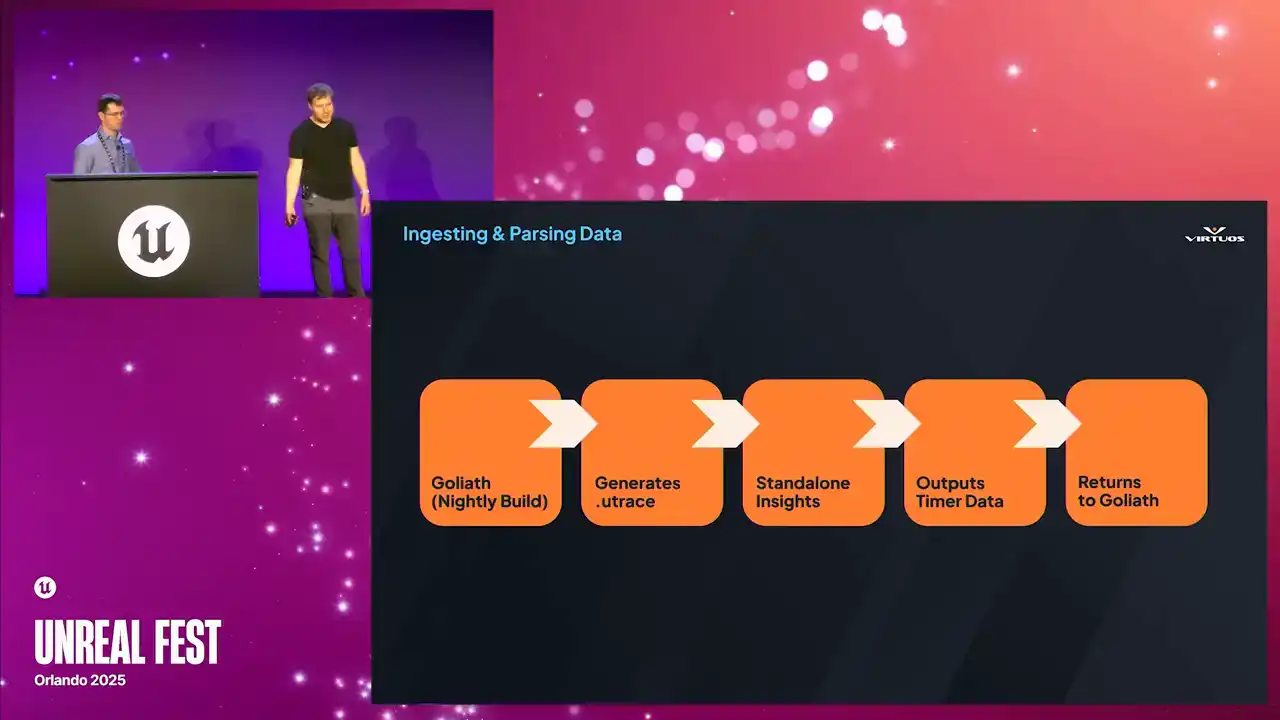
and extracts tens of thousands of the labeled timers that Insights is so good at getting. Everything from your shadow depth, render velocities, and thousands more. All of that data gets passed back into Goliath as a structured metrics. Now, we're not just collecting those snapshots, we're capturing the full breakdown of the engine, or full breakdown of what the engine was doing
at the time of the checkpoint, and effectively turning those huge U traces into thousands of individual timers.
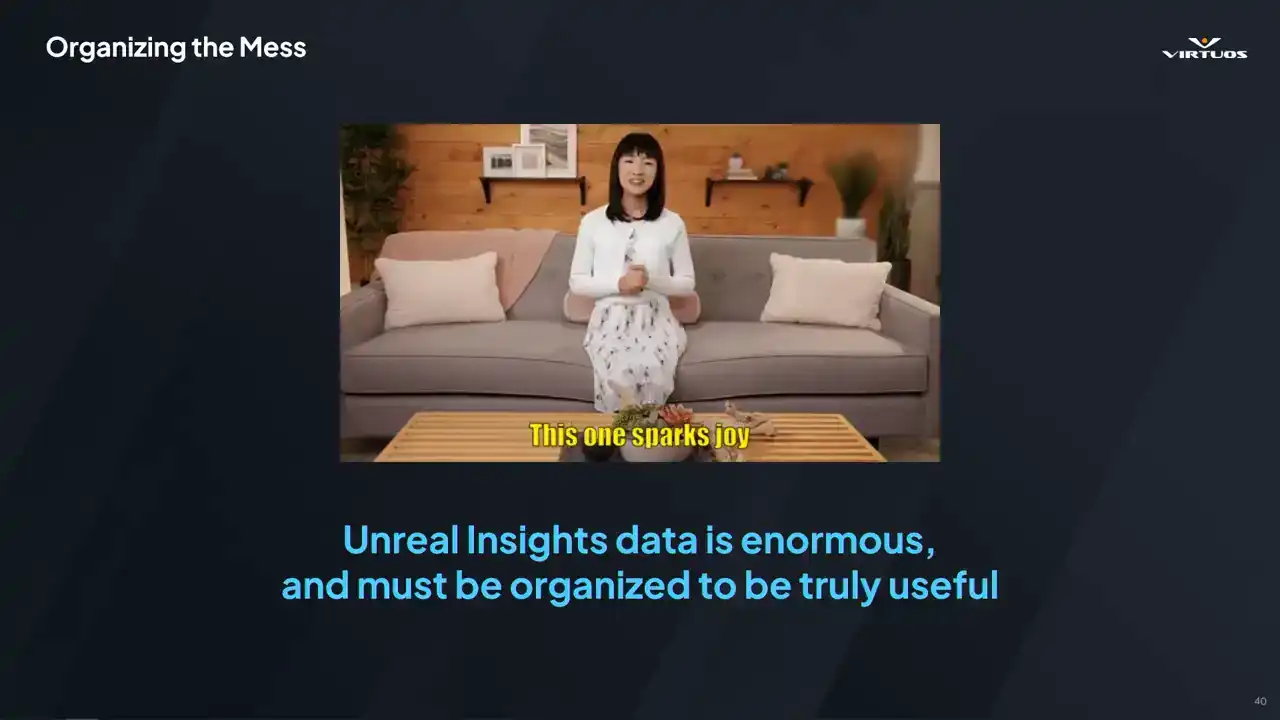
So let's take a breath for a second at this point. What we've ultimately done is created a huge list and a very messy pile of data. So we're gonna enlist the help of Marie Kondo here. Because in reality, we have a lot of very useful,

but very disorganized data at this point. The insights GUI has a purpose and it does it very well. It's great at displaying that kind of a data,
but it's not useful for us. So it's not fit for, once we've, sorry, once we process this data, it's not really fit for viewing for anyone. And what we need to do is organize that back into a form that sparks joy.
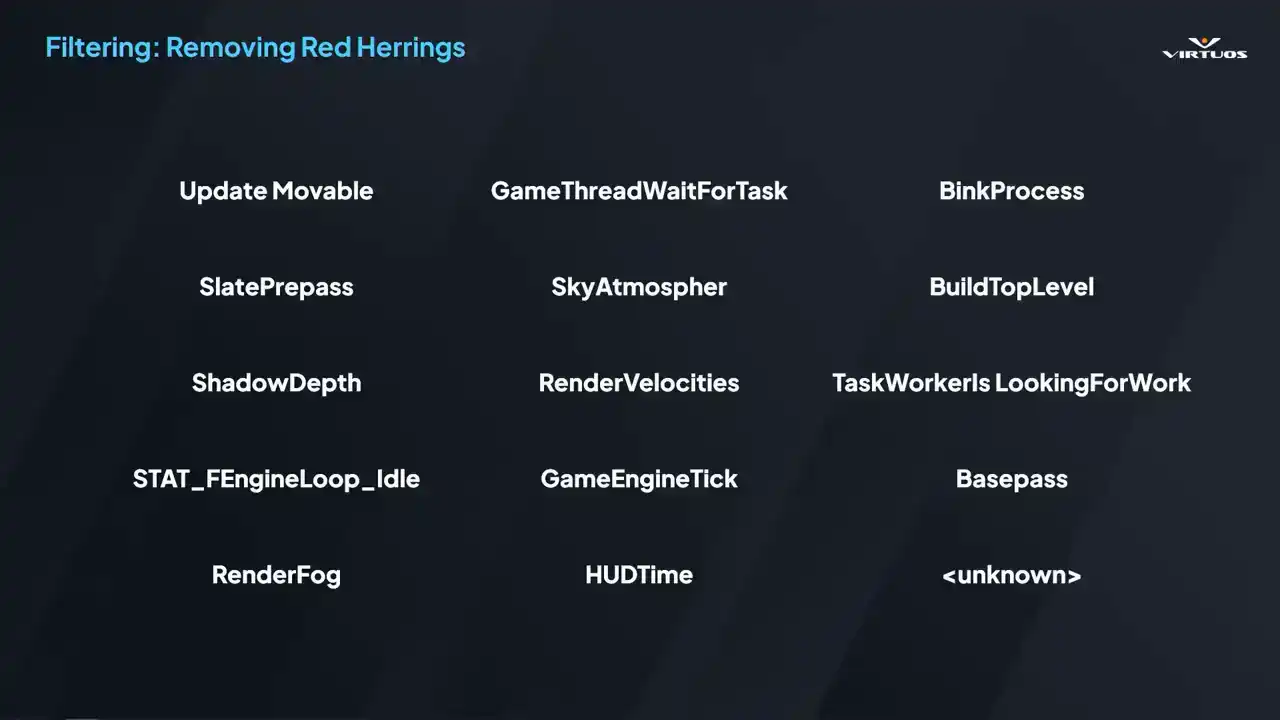
So the next step, basically, is to make it make sense. We start out by filtering the noise. Timers that appear in every frame, but don't actually contribute in a meaningful way. Things like those housekeeping calls, placeholder events, and my ever useful favorite of unknown in the corner here, we can get that out of the way. What we want is to, or what we do is we maintain
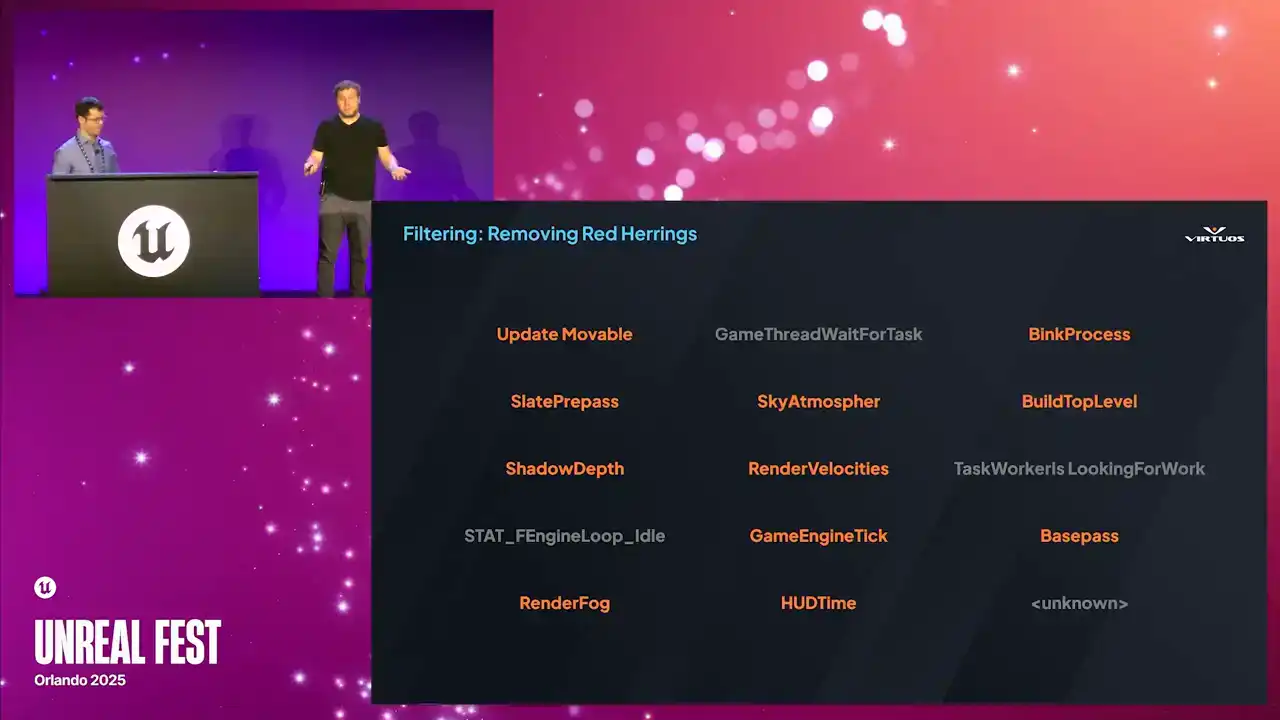
a dynamic list of red herrings, and we strip them out of the data. That way the data of the Goliath shows is always relevant, and no more hunting through 12 pages of junk just to find that one useful clue. Once we filter that noise,
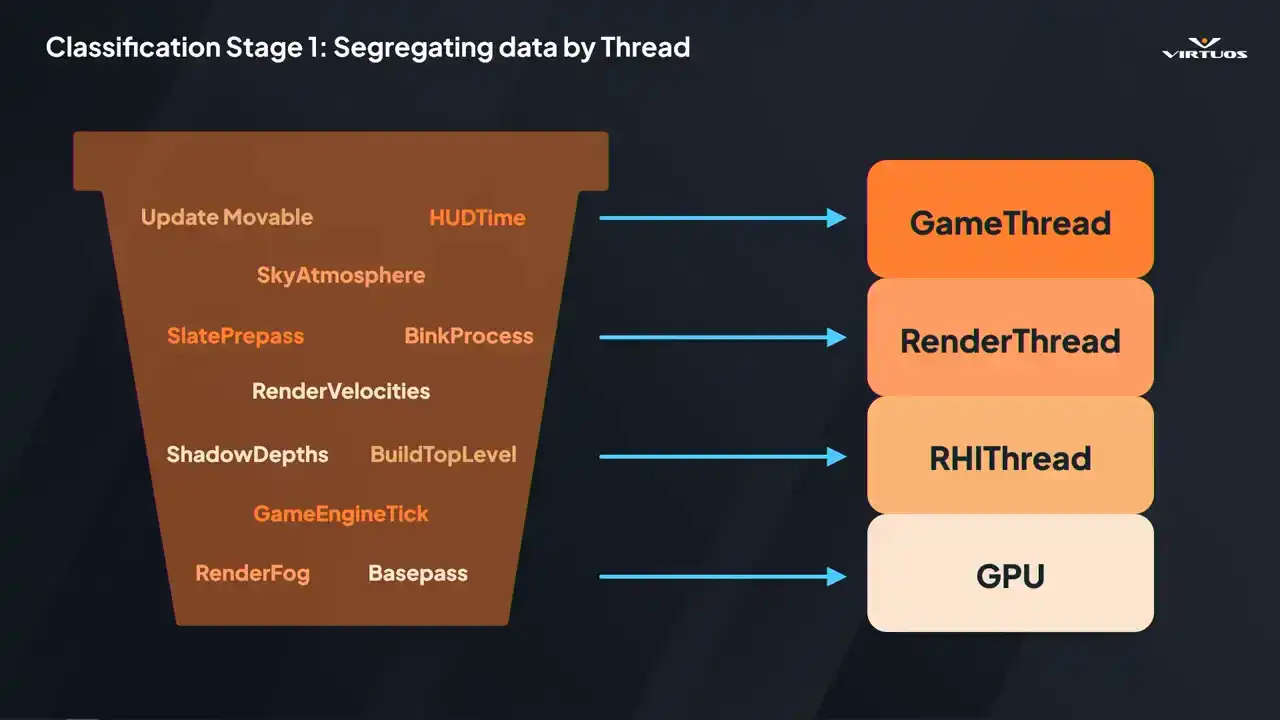
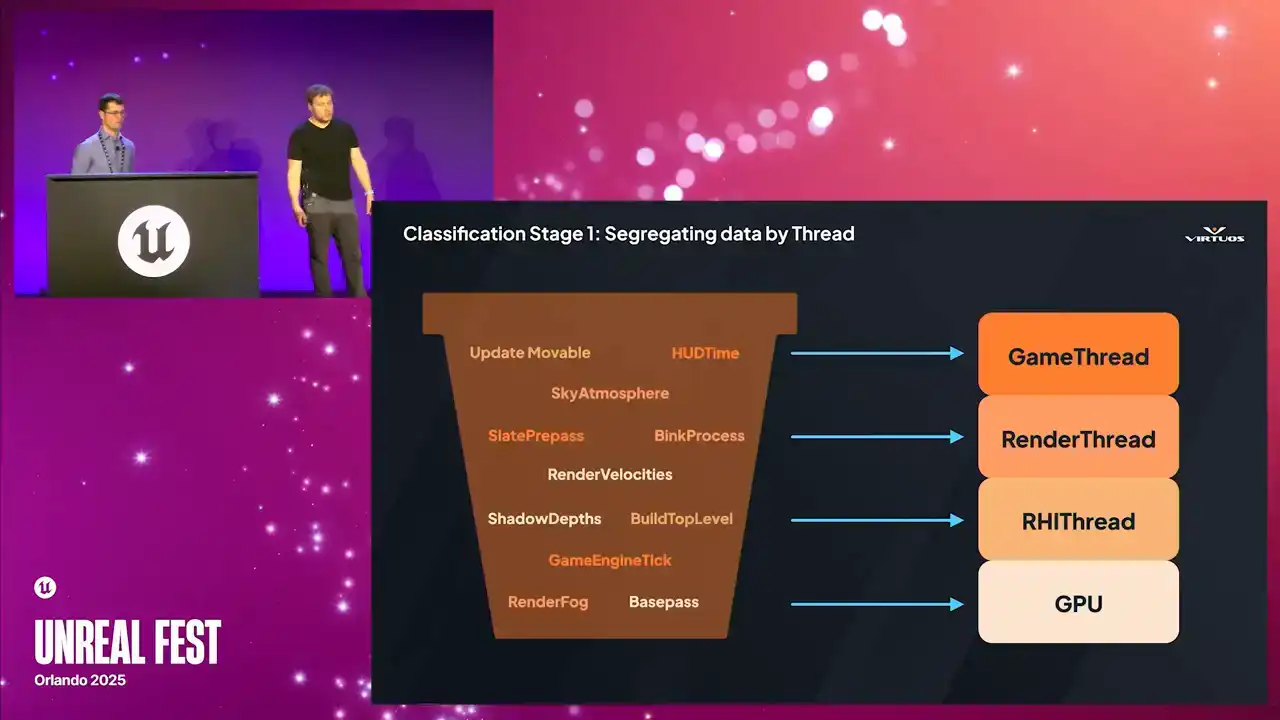
we form our first pass of grouping by thread. We have our game, our render, RHI and GPU. This is our high level pass of classification. And why do we do that? Because thread classification gives you that first level of triage It really narrows the problem space and it helps us dive into the right areas without much guesswork But after classification we have that narrower set of timers labeled by thread. But we want to look at it in a different way,
and again, maybe a deeper and more nuanced grouping for the next stage. So once we've filtered and done our first pass, we still have that raw list of timers. And the next step is grouping them into what we call event
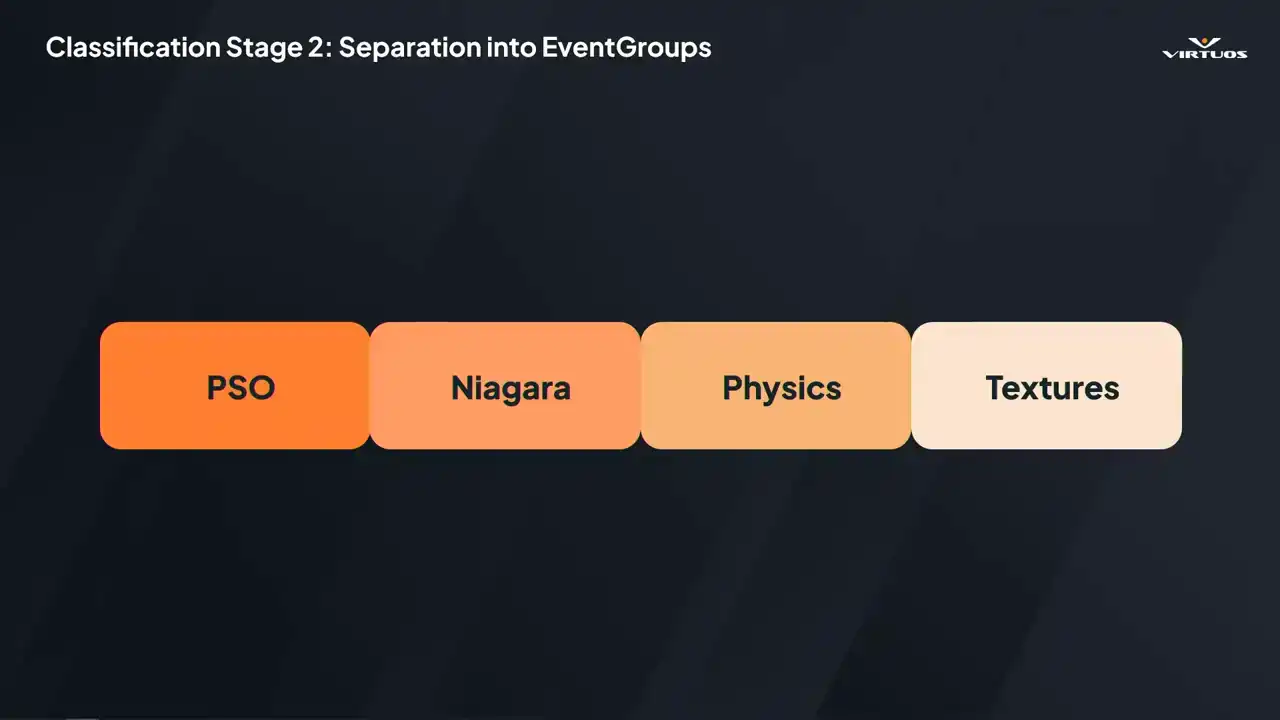
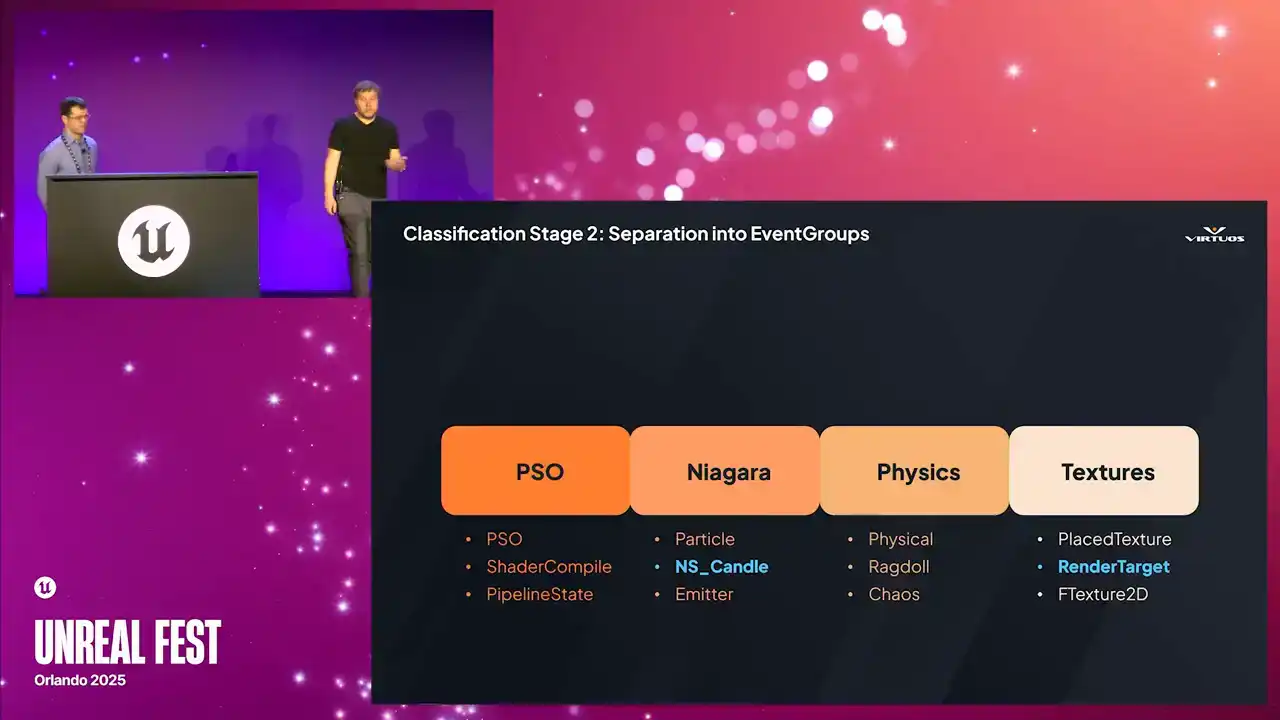
groups. So I briefly mentioned this earlier. And essentially all an event group is, is a dynamically defined container of related timers. Things that logically belong together. Some event groups we defined included,
the examples up here, we have PSO, Niagara, physics, textures. Each has a clear performance story and an actionable optimization paths. So they make sense to be grouped together. The goal really is to reduce those 20,000 plus

individual timers down to maybe 30 meaningful groups. granular enough to be useful, but clean enough to visualize in Goliath.
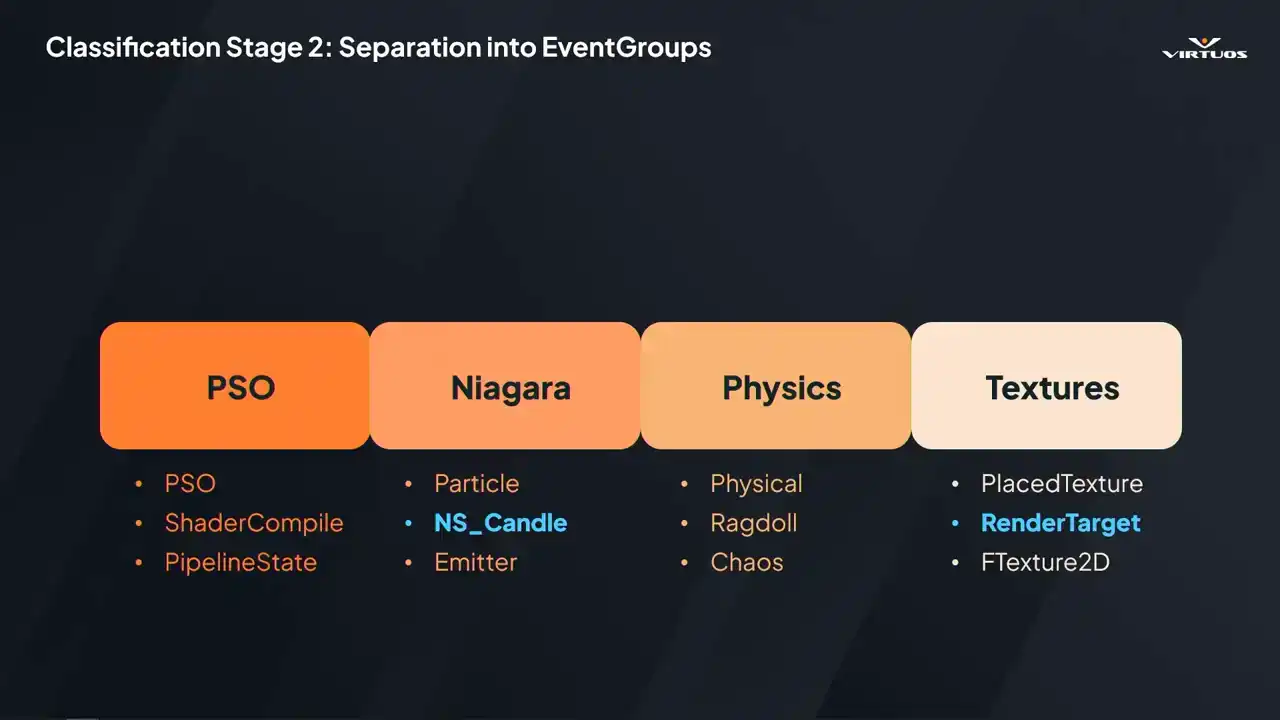
So essentially the process here is that each group uses pattern matching to capture those relevant timers. For example, the Niagara group might match patterns like our particle, our NS candle, and emitter. It's worth mentioning that these groups are hierarchical. So if a timer matches something specific, like Niagara, it's excluded from a broader category like textures.
That way, each timer ends up in its most relevant place, but we also make sure that it is captured somewhere and nothing falls through the cracks. So to wrap that up, here we see those matches.
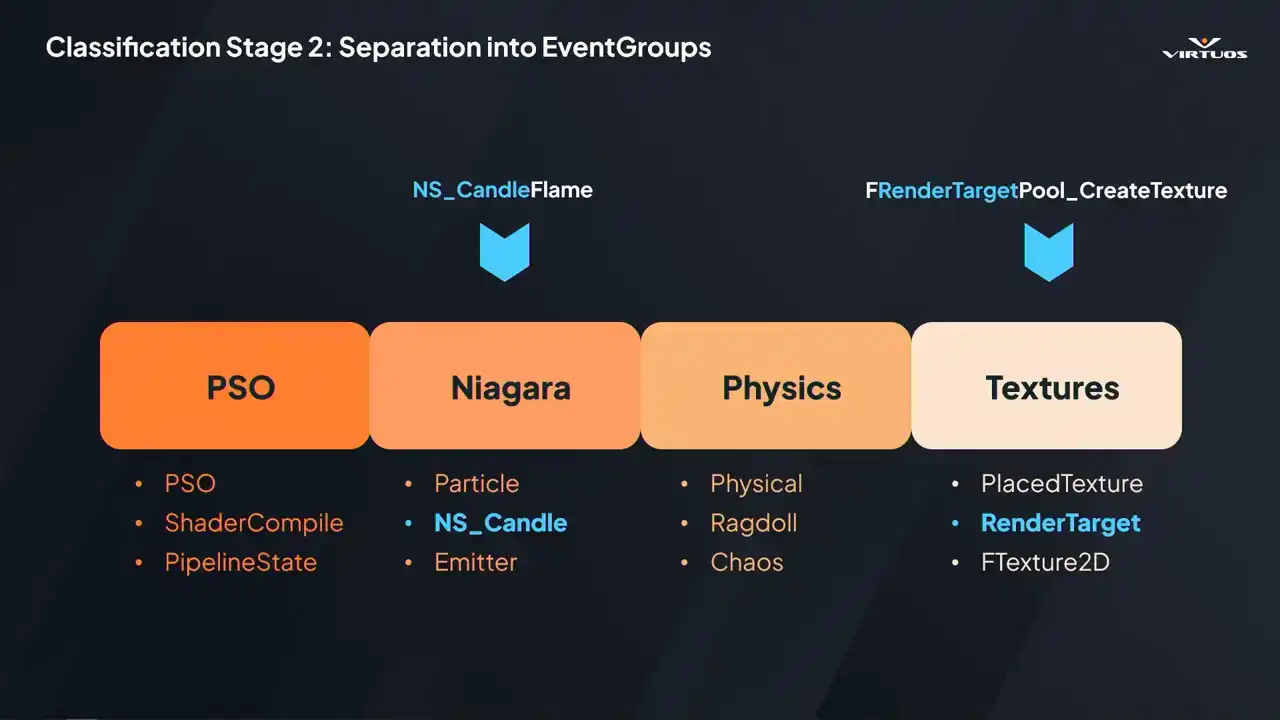
We have our NSCandle flame being caught into the Niagara group based on the NSCandle group, and that's it really. It's a relatively simple process, but what we found is it actually gives us a huge amount of flexibility to organize the data in ways that's relevant for us in the project.
And ultimately, this all comes together in our one fully integrated dashboard and solves that problem we were talking about before of having to leave the ecosystem. This is our single source of truth. Connects those high-level budgets, time series graphs, and low-level insights data into one coherent system. But getting there took more than filtering, took interpreting and structuring the data in key ways,
but ultimately it makes it easier to store, easier to visualize, and ultimately easier for developers to act on.

There we go. All right. Building an interesting tool, demands will come.
So we have more feature requests than staff months, some quality of life requests, maybe manage the playlists on the web interface, have better graph management, et cetera, et cetera. For now, we're focusing on a few more fundamental upgrades.
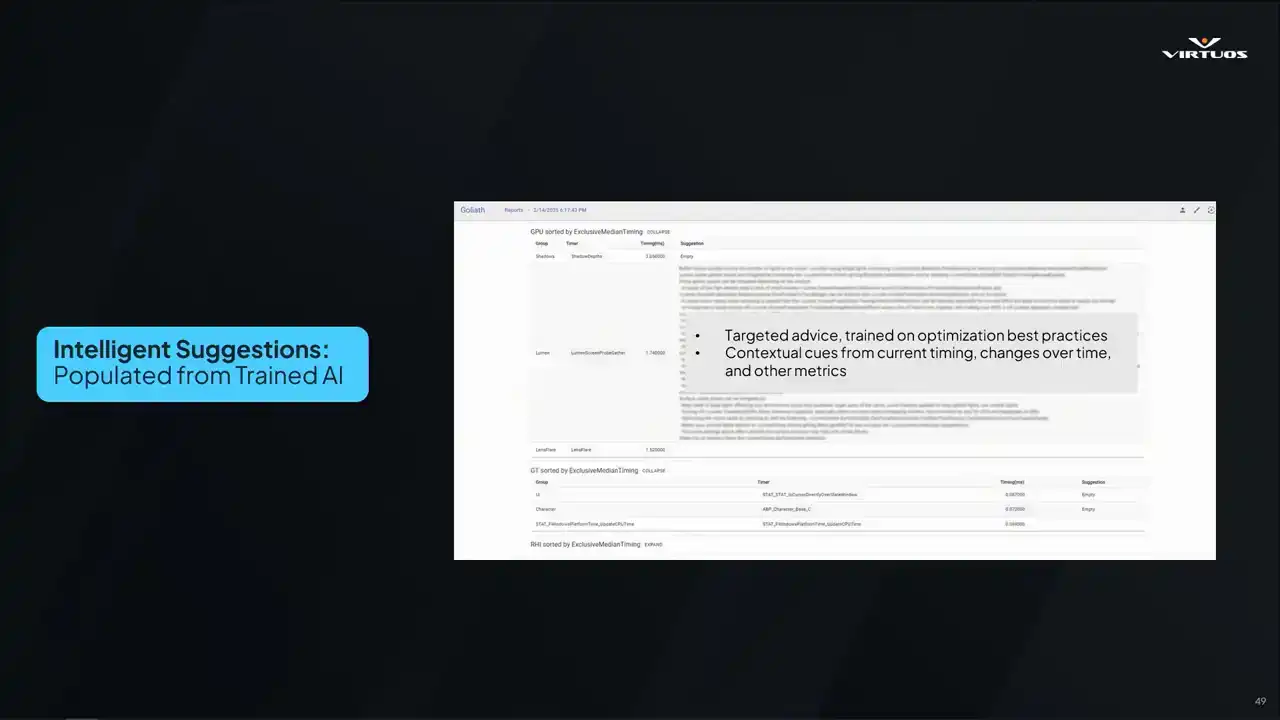
One thing that we didn't really talk too much about is there's a little system here where we've got some manually curated optimization advice. So let's say we see a Lumen bottleneck, we recommend some CVars or debug views. And a lot of this is based on data that we found on the internet, our own optimization experience was applied already to the project. However, what would be great is if we could leverage AI or some large language models to kind of enhance this performance advice system. So if we could read through all the historical data, plus those developer notes, and we can generate context aware optimization advice on the fly.
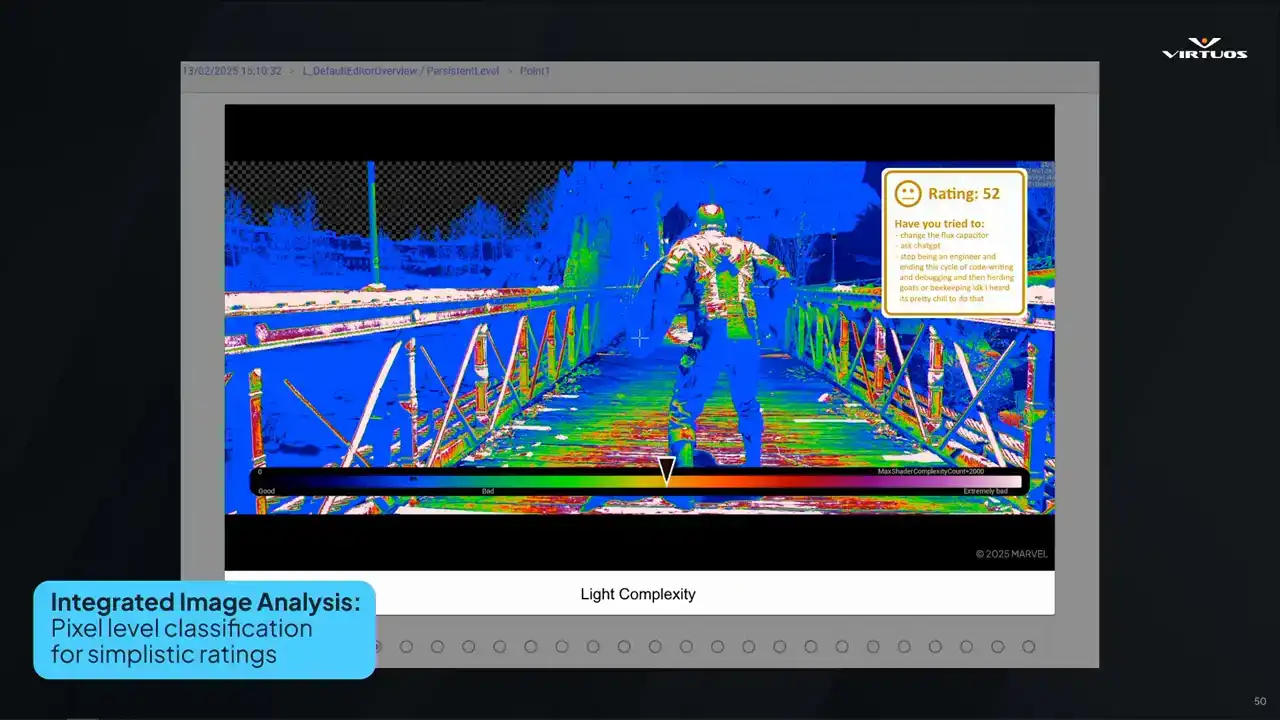
Second, we would wanna have integrated image analysis of those debug images. Eliminating the need for engineers to manually interpret the images they're seeing. Suggestions such as changing the flux capacitor, asking chat GPT, or maybe just seeking a new career in beekeeping, you know, it'd be nice to be one with nature.
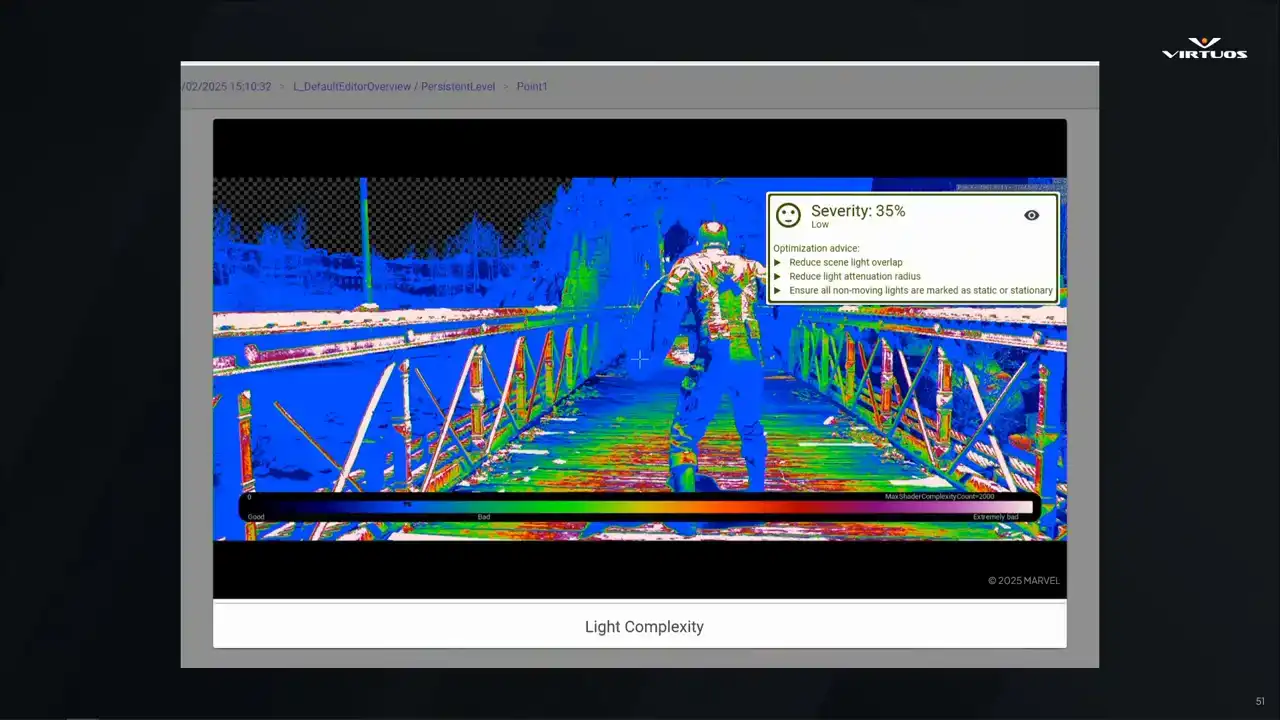
While writing this talk, our engineers actually went ahead and implemented it. So now we have pixel level classification for ratings. There's an automated grading of the debug images. There is analysis pixel by pixel that generates an overall performance score. and it has some basic optimization advice there. By doing this analysis,
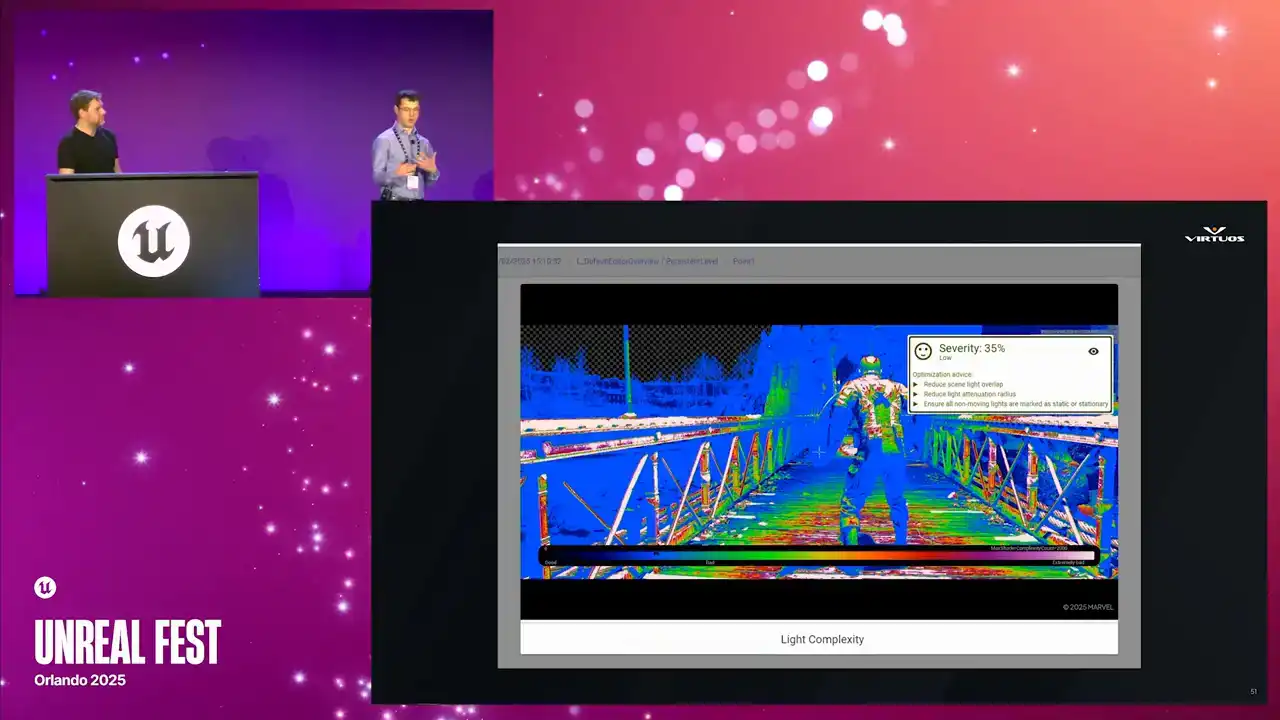
we can provide those quick and actionable suggestions, and it gives visibility to the entire team. And once again, this is where the power comes from, because instead of having a very specific subset of people that can interpret the data, now there's a wider pool of people who are engaged in this performance conversation.
If an image includes an existing legend from Unreal Engine will integrate that directly. Otherwise, the system will generate a custom legend to provide context. Crucially, because our existing pipeline was already in place, adding this feature was relatively simple. All we had to do was integrate the scoring logic. And that's the real power of a robust tool set. New ideas can be plugged in quickly,
amplifying everyone's ability to tackle performance head-on. We're also looking at integrating third-party tools, such as PIX and Razor, for an even robust data set. I think there might even be GPU insights coming in. The possibilities are limitless. As long as we ensure that the data we capture is crunched in a meaningful way, we can continue to improve the power of the tool and ensure developers get useful, immediate feedback.
Again, they can focus their efforts where it matters most, which is finding the fun. All right So we shared a lot about the tool and let bring it all home I suppose Performance capture or performance issues they just not going away right

Games are getting bigger, teams are more distributed, and the tech stack is more complex than ever.
But what we've learned is, if you make performance tracking part of your production process, not something bolted on at the end, you get better outcomes across the board.
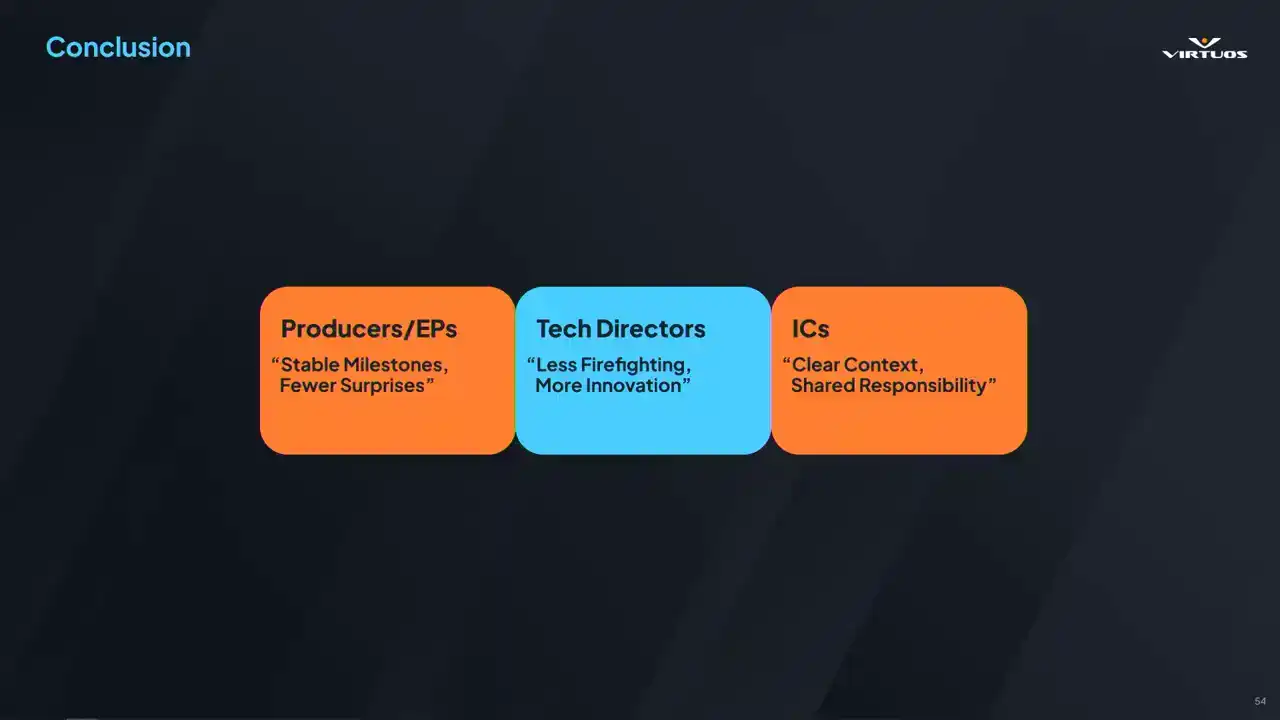
So ultimately, we hope that you're walking away. At least some of the people in the room will look at performance tracking on your own projects, becoming more of a standard process, an everyday practice, and not that last-minute scramble that we've been talking so much about. So if we haven't convinced you already, let's look at a couple of the different stakeholders
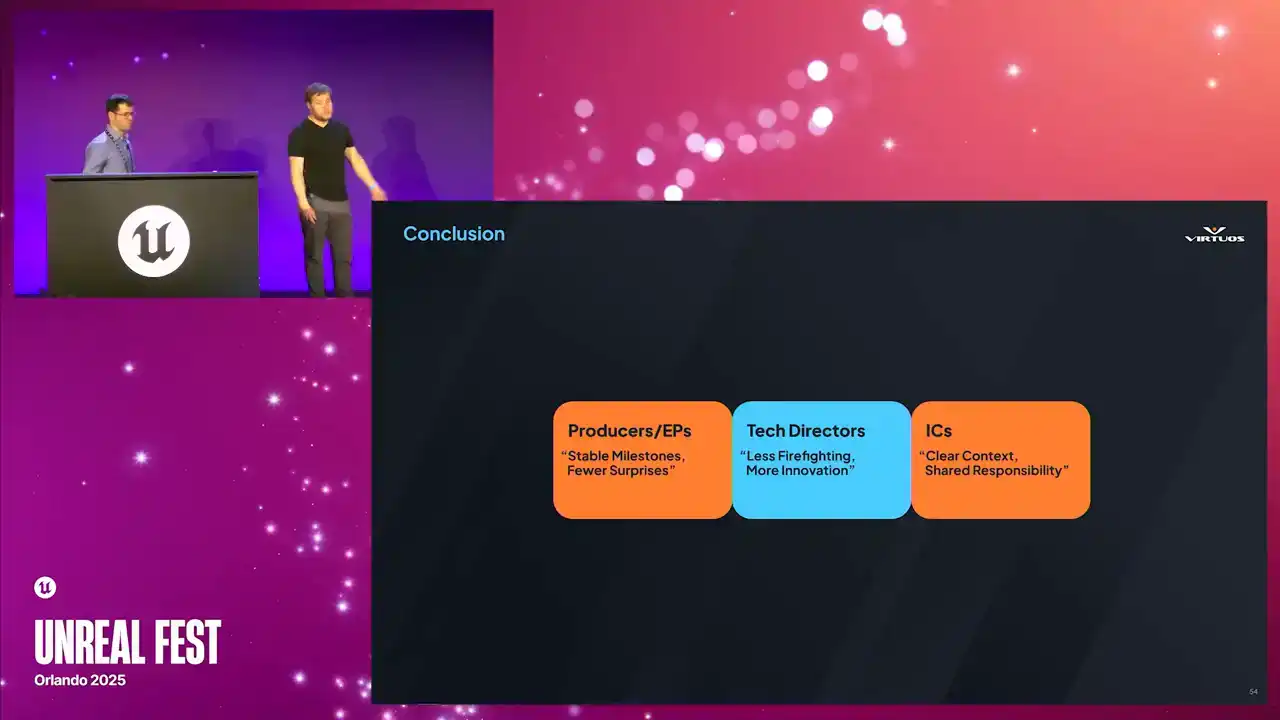
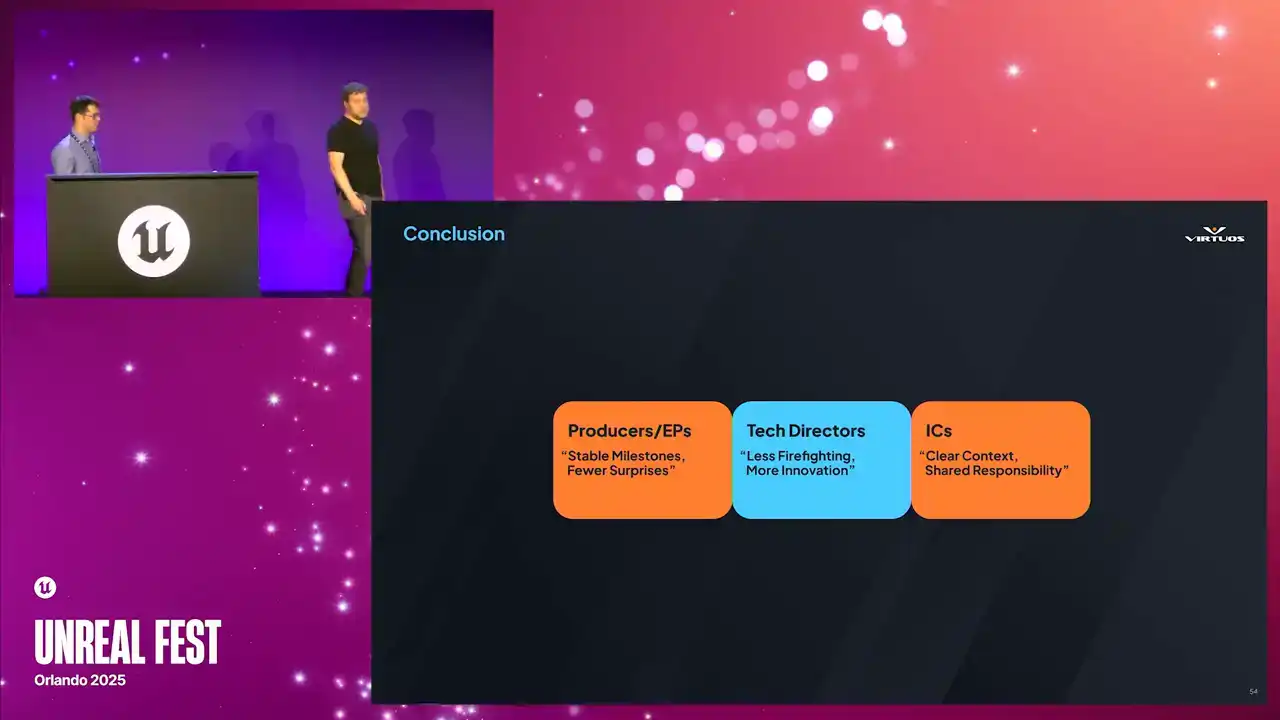
involved in every studio and how they each benefit from this approach. Producers in EPs, they gain that predictability. They can clearly see whether the product is on track or not, or if there's particular problems they have still ways to go to solving. Or, you know, ultimately if they need to pivot and deal with those problems. Tech directors, close to my heart, we understand where there are problems cropping up. We can assign developers more easily to a more understandable and tangible problem. And that just leads to tackling the problem earlier.
And ultimately, because what I care about is really building and focusing on that innovation and what makes that game stand out over firefighting. So we can change that workflow. And then ultimately, those individual contributors on the project, they can clearly see how their commits affect performance on a regular basis. And they'd end up being more invested and how the game is running. And that becomes a shared responsibility. And ultimately, that boosts morale and collaboration on the project. So beyond those immediate goals, continuous performance
monitoring also allows us to have those difficult conversations earlier. So at the end of the day, this really
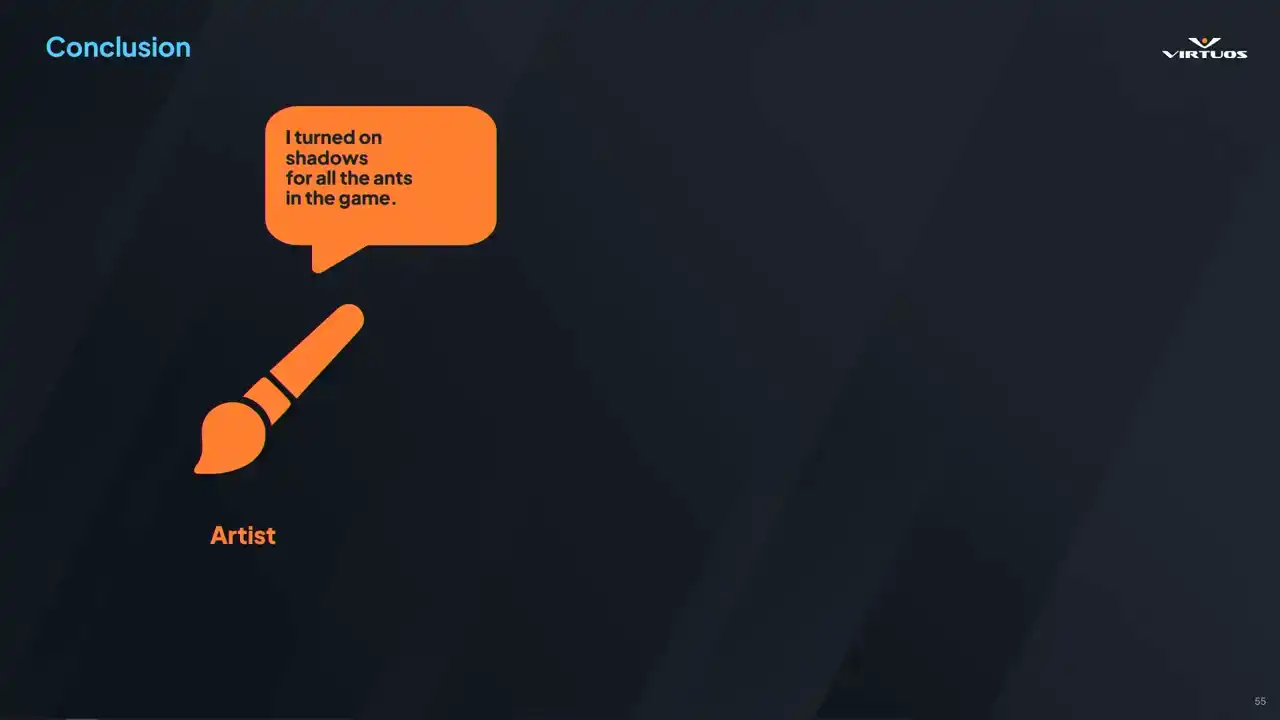
isn't just about those frame by frame budgets. It's about building a culture where optimization It isn't a scary process or mysterious. It's just part of how we make games. And to really emphasize that, let's take a look at our Skyrim scenario.
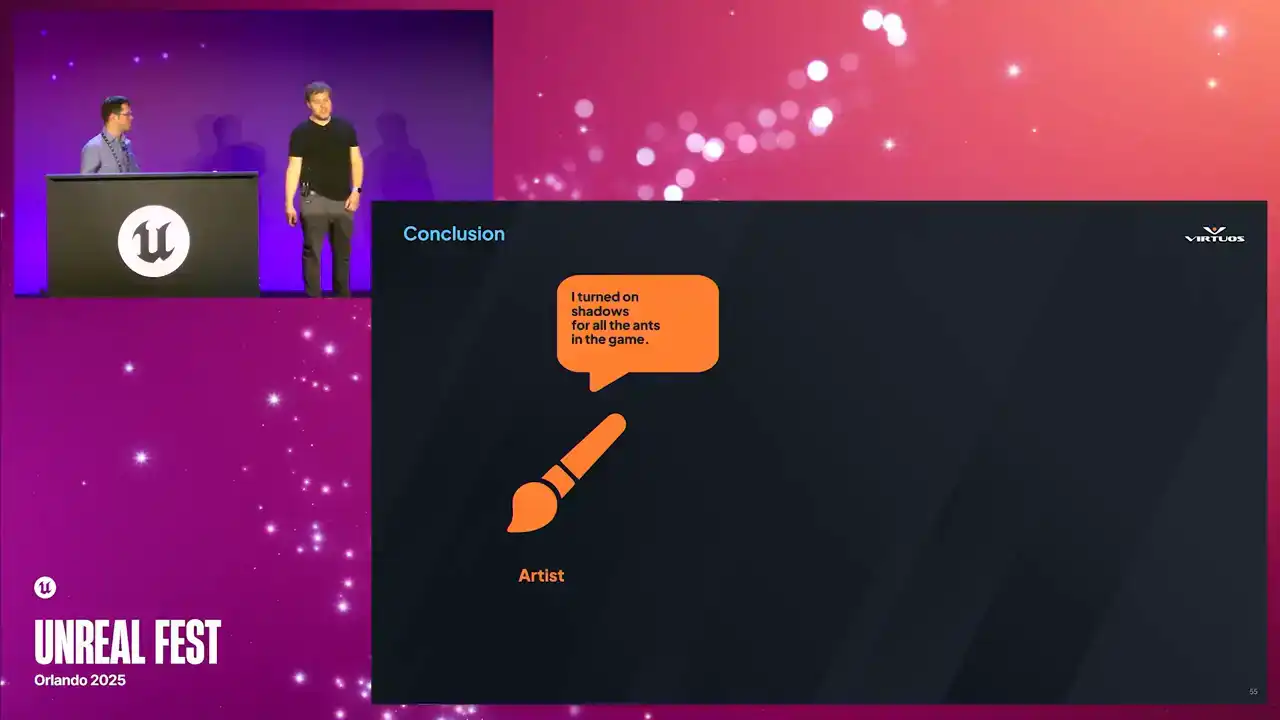
Now, admittedly, maybe this is an idealized version of that, but think about how our approach can change this conversation. Our enthusiastic developer, he turns on the shadows in the whole game, on all the ants in the game.
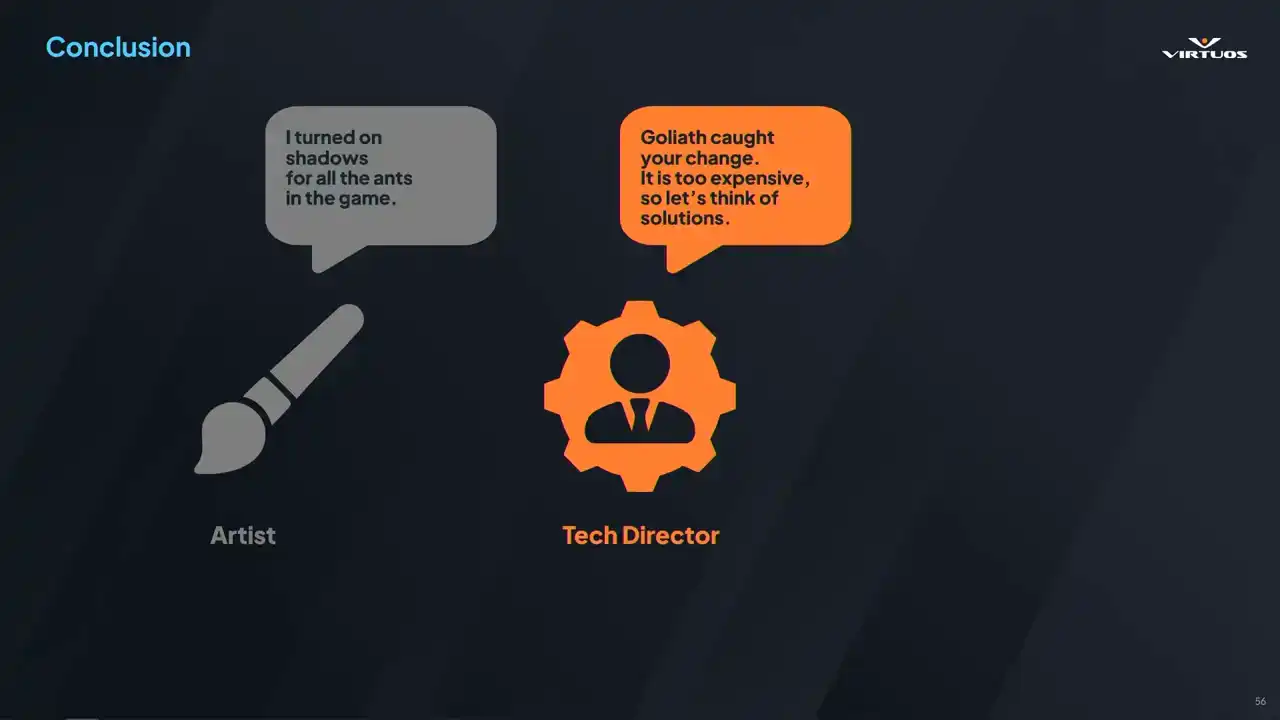
But unfortunately, I have to step in as a tech director and say, well, that's cool, it looks great, but performance is dying, it's too expensive. But in this scenario, it's mid-production, I have time, I have some resources available to me, and I can say, well, it's not usable as is, but let me assign a dev to the challenge, and we can work together to find a solution for this. And ultimately, our superstar developer invents a new shadowing technique that works amazingly for thousands of ants in the game and that part of the map. And so, as I said, maybe this is idealized. We're not going to invent a new technology and solve the problems every time. But this is the healthy type of discussion
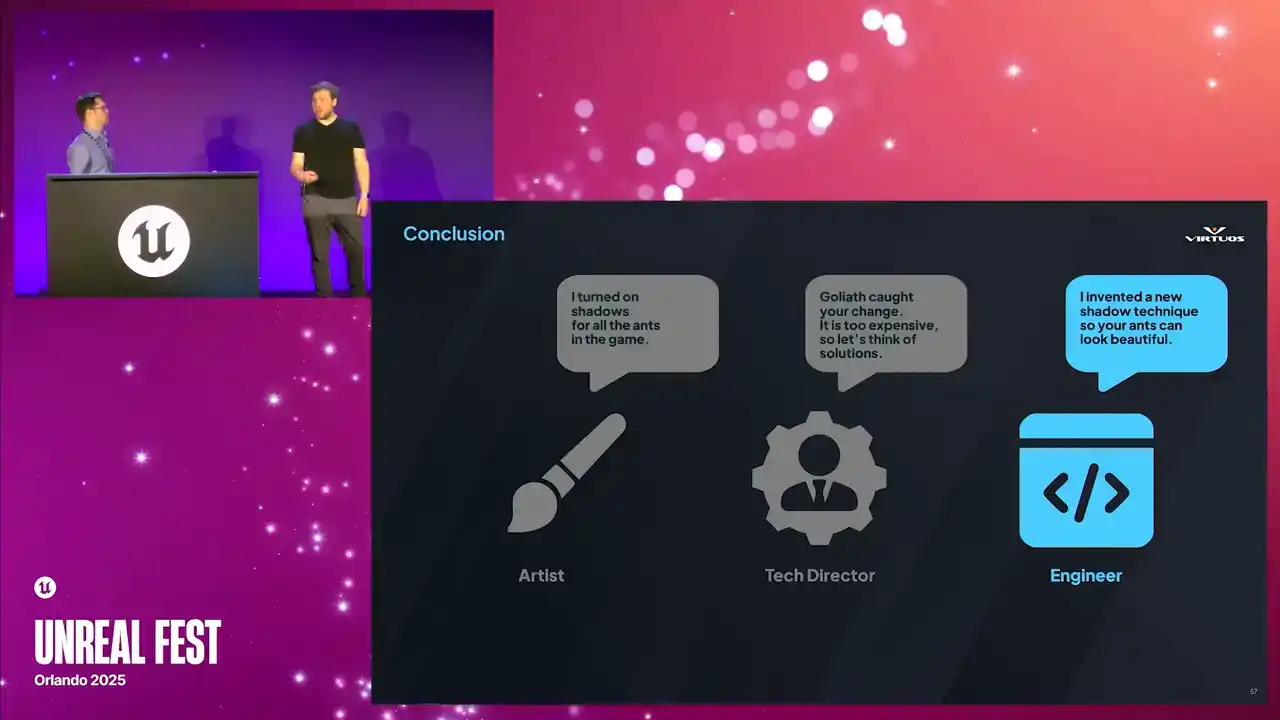
that you can have when we track these problems earlier. We can dig in and balance those visual tweaks that we want, the features, and the performance when we've caught them early.
So hopefully by now, you want to be having these kind of conversations on your team. But maybe it seems a little bit daunting. And our only advice is pretty simply this. Start with small steps. Try and find some daily captures. Build a simple dashboard. And you'd be surprised that these simple things really can change your perspective. With that.
Some of you might ask perhaps about the return on investment from such a system. I mean, it's really hard to put a precise dollar figure on fewer crises or higher team morale.
There's massive intangible benefits, right? There's less overtime. There are fewer emergency patches, reduced risk of failing TRCXRs, and less risk of cutting features at the last minute.
Ideally, again, game quality will go up, both for the product and the health of the team. This data could even be used to show other decision makers and publishers. They can see that you've got a handle on the performance landscape, and things are going
on track. So ultimately, it's not about saving time and money. We're here really empowering teams to meet their potential. By weaving performance monitoring into the development fabric, you free your people to do what they do best, which is innovate, create, and deliver unforgettable experiences.

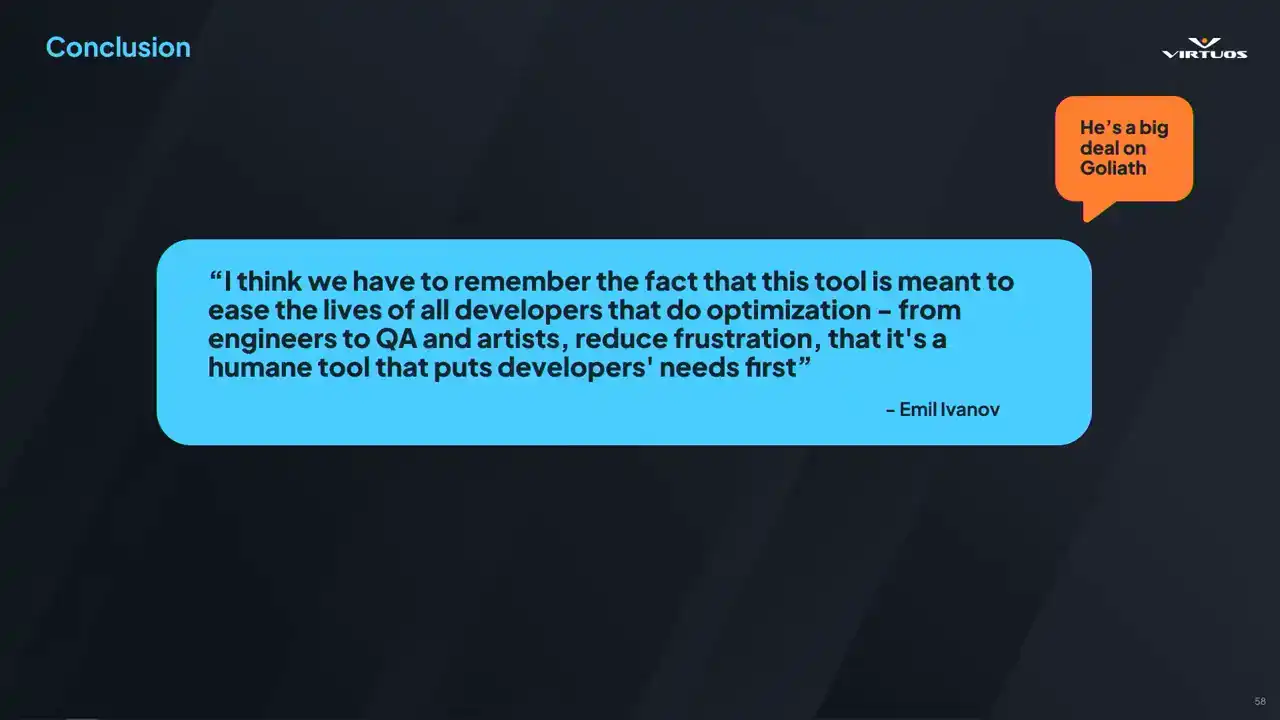
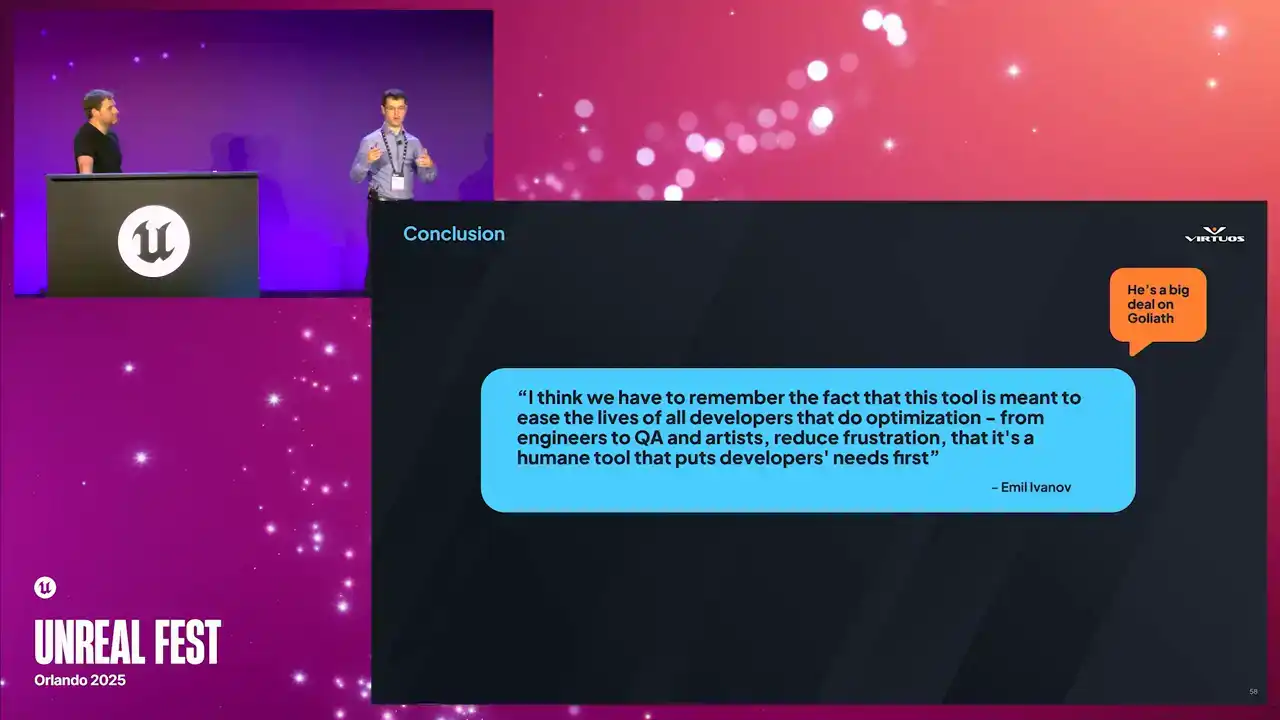
The tool we developed was in collaboration between several virtual studios, notably in Montpellier, of course Skydance Games, and ML. And I'd like to end with a quote from him.

I think we have to remember the fact that this tool is meant to ease the lives of all developers that do optimization, from engineers to QA and artists.
Reduce frustration that it's a humane tool that puts developers' needs first. Thank you very much.